Fig. A.1.
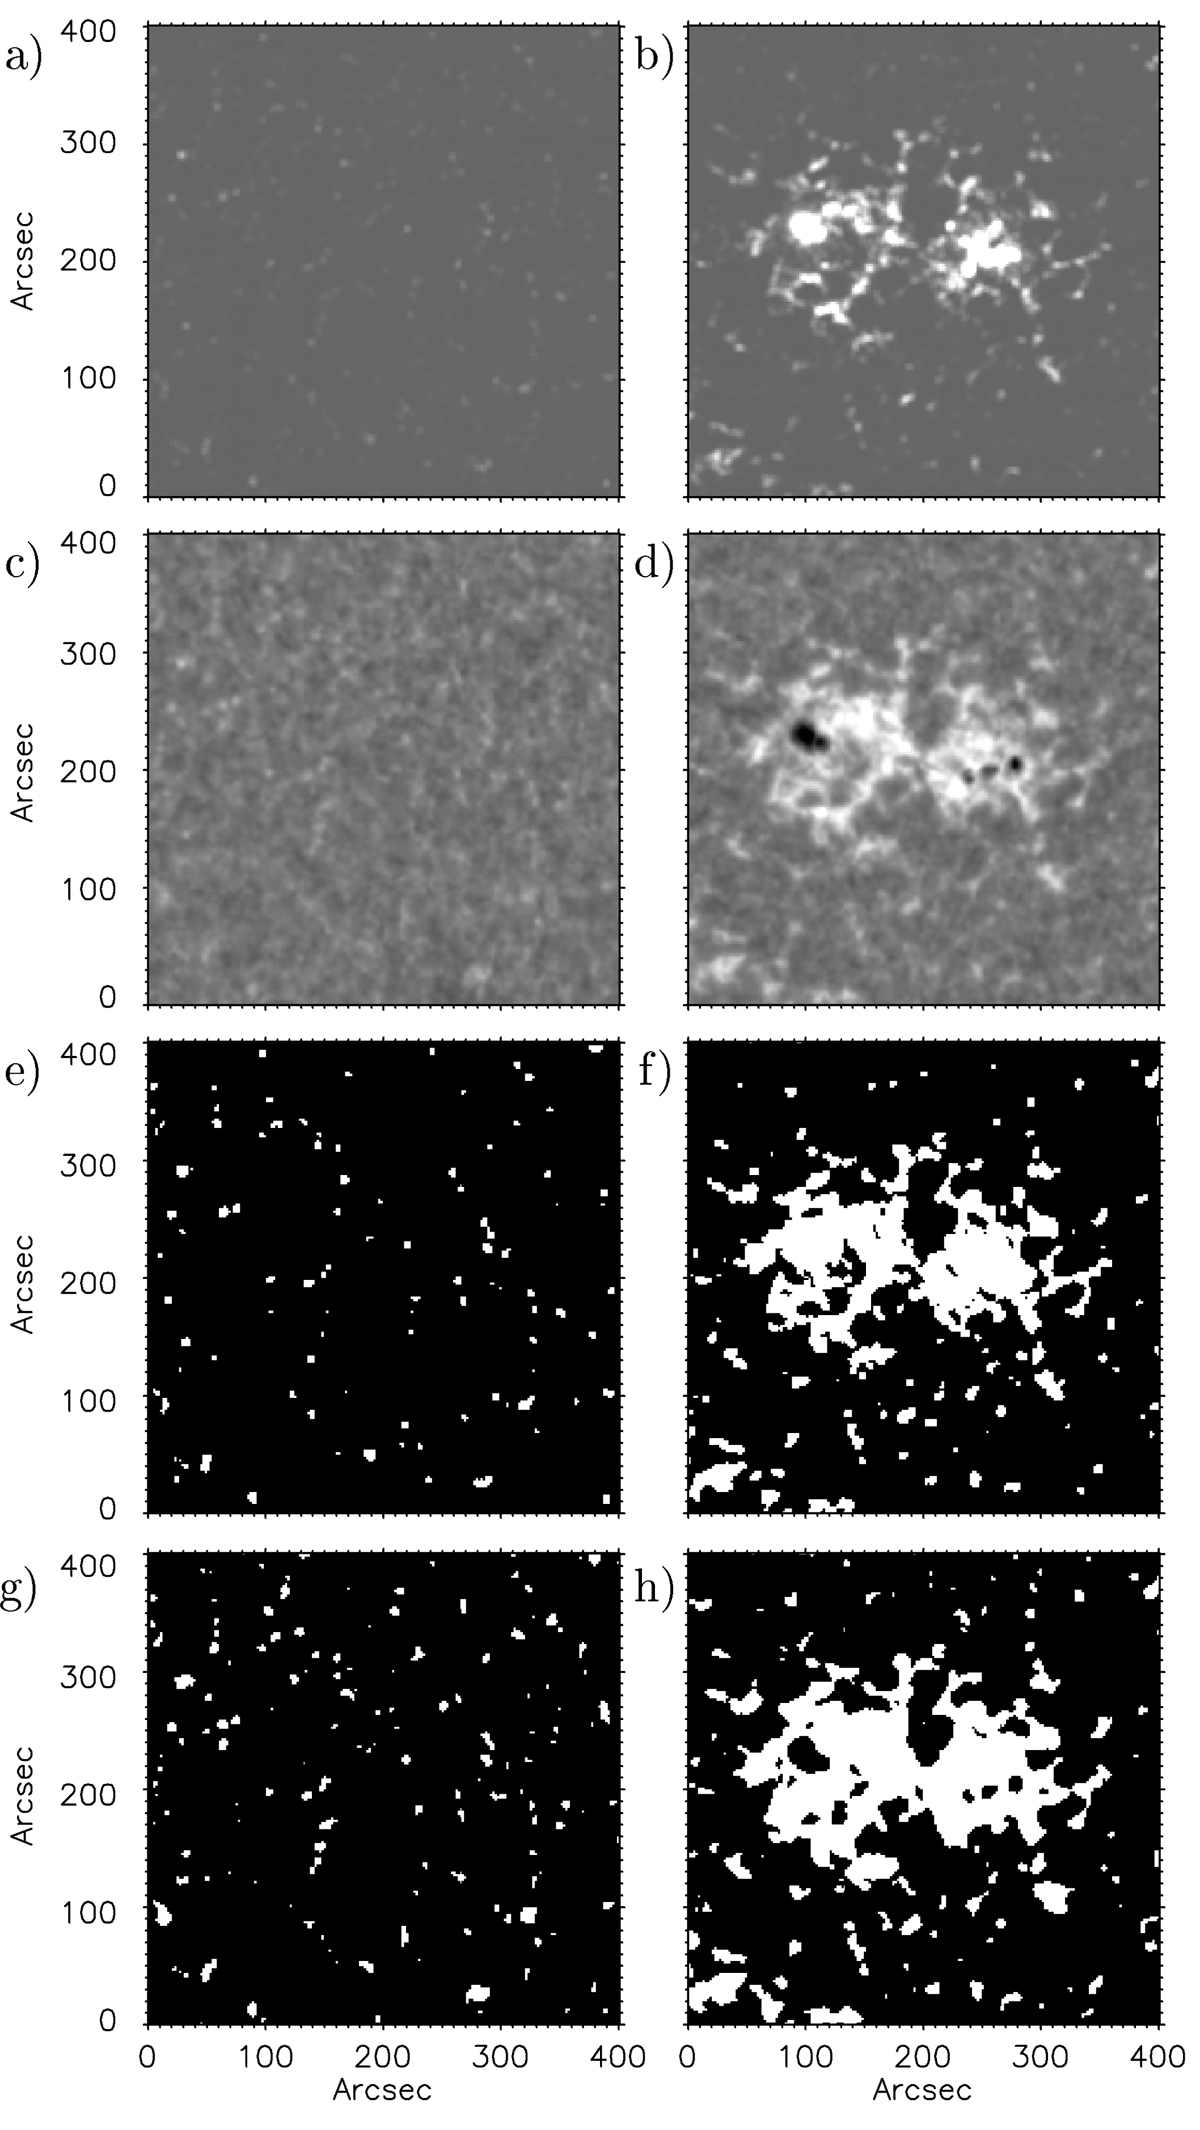
Magnified 400 × 400 arcsec2 sub-arrays of the images shown in Fig. 1 for a network (left) and a plage region (right). From top to bottom: (panels a and b) SDO/HMI unsigned (and spatially degraded) magnetogram; (panels c and d) Rome/PSPT Ca II K; the corresponding segmentation masks derived with Method 1, i.e. constant thresholds, from (panels e and f) the magnetograms and (panels g and h) the Ca II K images. The magnetograms are saturated in the range [−300,300] G (the negative value was chosen merely to improve visibility of the pixels), and Ca II K observations in the range [0.5,1.6] (the QS has an average value of 1).
Current usage metrics show cumulative count of Article Views (full-text article views including HTML views, PDF and ePub downloads, according to the available data) and Abstracts Views on Vision4Press platform.
Data correspond to usage on the plateform after 2015. The current usage metrics is available 48-96 hours after online publication and is updated daily on week days.
Initial download of the metrics may take a while.