Fig. 16.
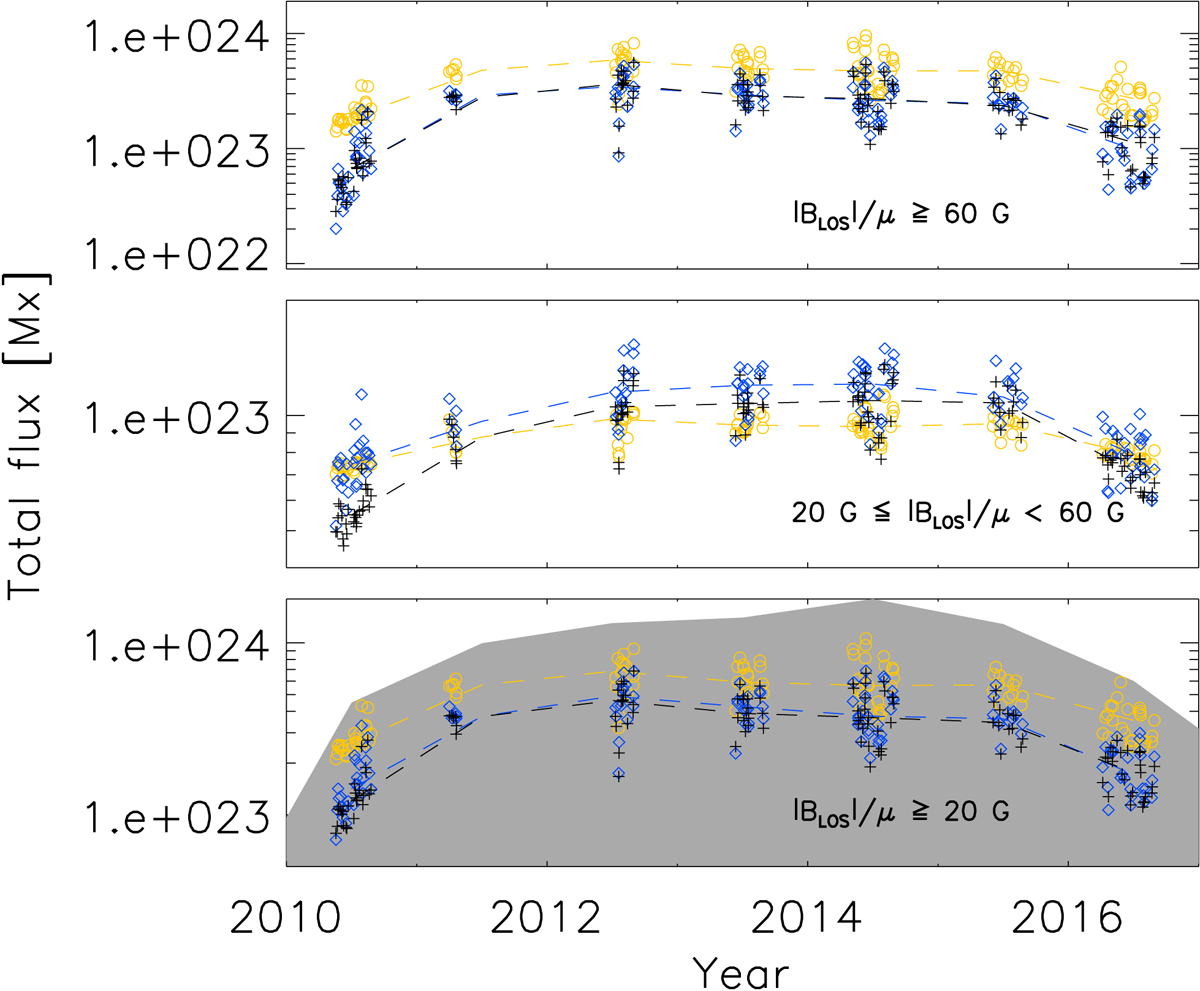
Total unsigned magnetic flux in Mx of AR derived from the magnetograms (yellow circles for the original and black plus signs for the reduced spatial resolution ones) and from the unsigned magnetograms reconstructed from Ca II K observations with PFL* (blue rhombuses). Each of the upper two panels corresponds to a different type of features (as listed in the panels) identified with Method 1, while the bottom panel is for all features together. The dashed lines connect the annual median values. The shaded surface in the lower panel is as in Fig. 15.
Current usage metrics show cumulative count of Article Views (full-text article views including HTML views, PDF and ePub downloads, according to the available data) and Abstracts Views on Vision4Press platform.
Data correspond to usage on the plateform after 2015. The current usage metrics is available 48-96 hours after online publication and is updated daily on week days.
Initial download of the metrics may take a while.