Fig. 15.
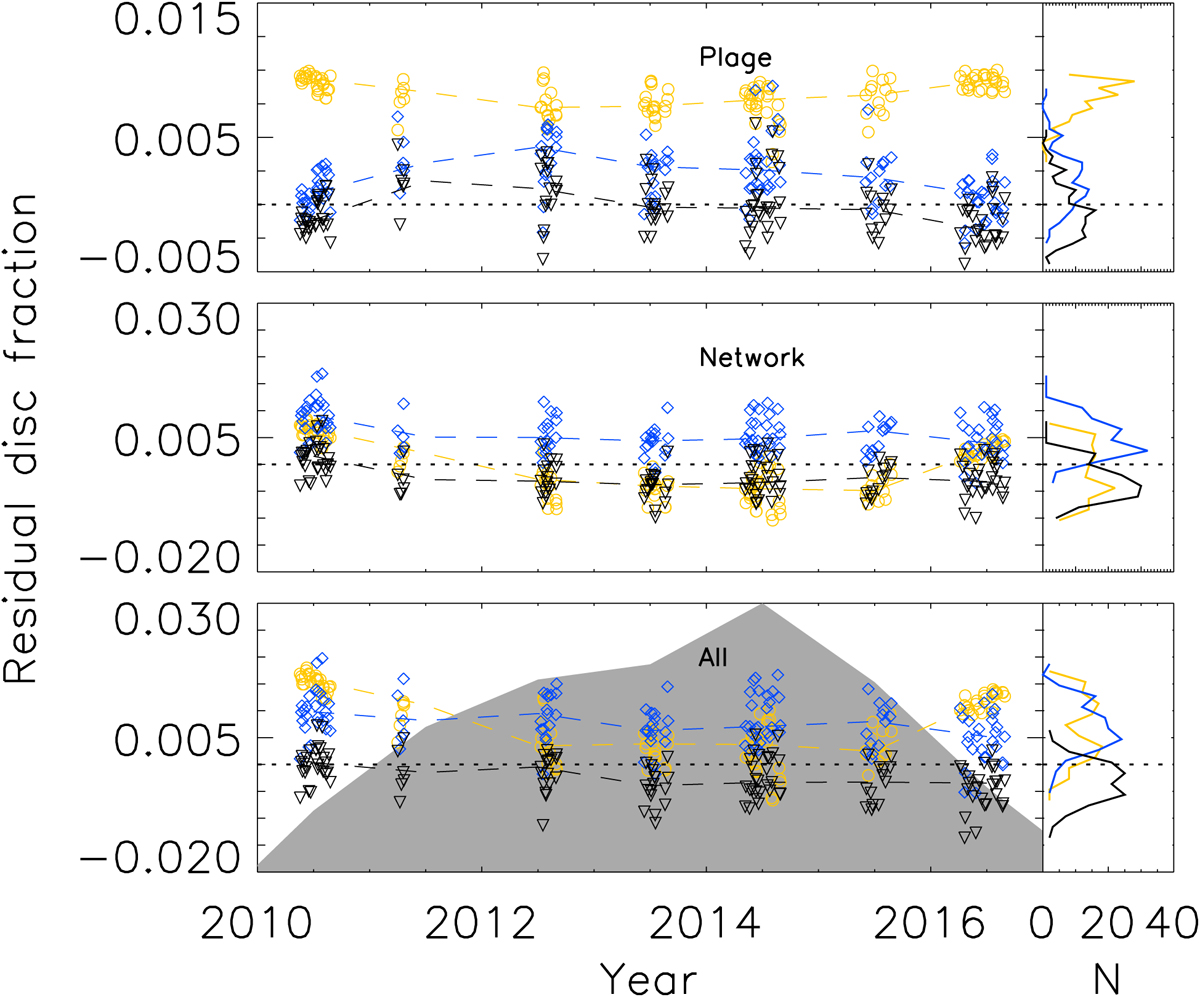
Left: difference between the disc fraction of magnetic features derived from SDO/HMI observations with reduced spatial resolution and Rome/PSPT (black downward triangles), SDO/HMI with original spatial resolution (yellow circles), and reconstructed magnetograms with PFL* (blue rhombuses). Each of the upper two panels corresponds to a different feature (as marked in each panel) identified with Method 1, while the bottom panel is for all features together. The dashed lines connect annual median values, while the dotted horizontal lines are for a difference of zero. The shaded grey surface in the lower panel shows the plage areas determined with Method 1 from the Rome/PSPT images. The areas were scaled to match the range of the plot and are included to indicate the level of solar activity. Right: distribution functions of the residual disc fractions.
Current usage metrics show cumulative count of Article Views (full-text article views including HTML views, PDF and ePub downloads, according to the available data) and Abstracts Views on Vision4Press platform.
Data correspond to usage on the plateform after 2015. The current usage metrics is available 48-96 hours after online publication and is updated daily on week days.
Initial download of the metrics may take a while.