Fig. 14.
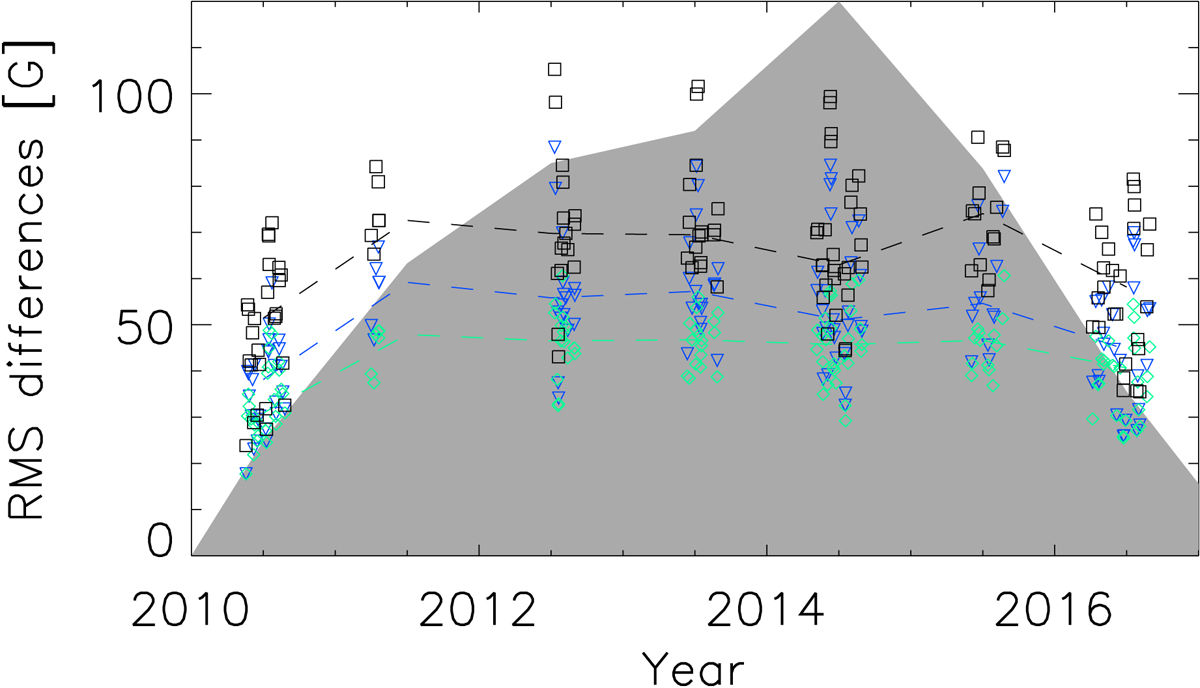
rms pixel by pixel differences in G between the original unsigned magnetograms and the reconstructed ones using the parameters (listed in Table 2) derived from the PFL* fits for the whole disc (blue downward triangles) and by masking out the sunspot regions (green rhombuses). Also shown is the standard deviation of the original unsigned magnetograms (black squares). The dashed lines connect annual median values. The shaded grey surface shows the plage areas determined with Method 1 from the Rome/PSPT images. The areas were scaled to have a maximum value of 120 and are included to indicate the level of solar activity.
Current usage metrics show cumulative count of Article Views (full-text article views including HTML views, PDF and ePub downloads, according to the available data) and Abstracts Views on Vision4Press platform.
Data correspond to usage on the plateform after 2015. The current usage metrics is available 48-96 hours after online publication and is updated daily on week days.
Initial download of the metrics may take a while.