Open Access
Fig. 13.
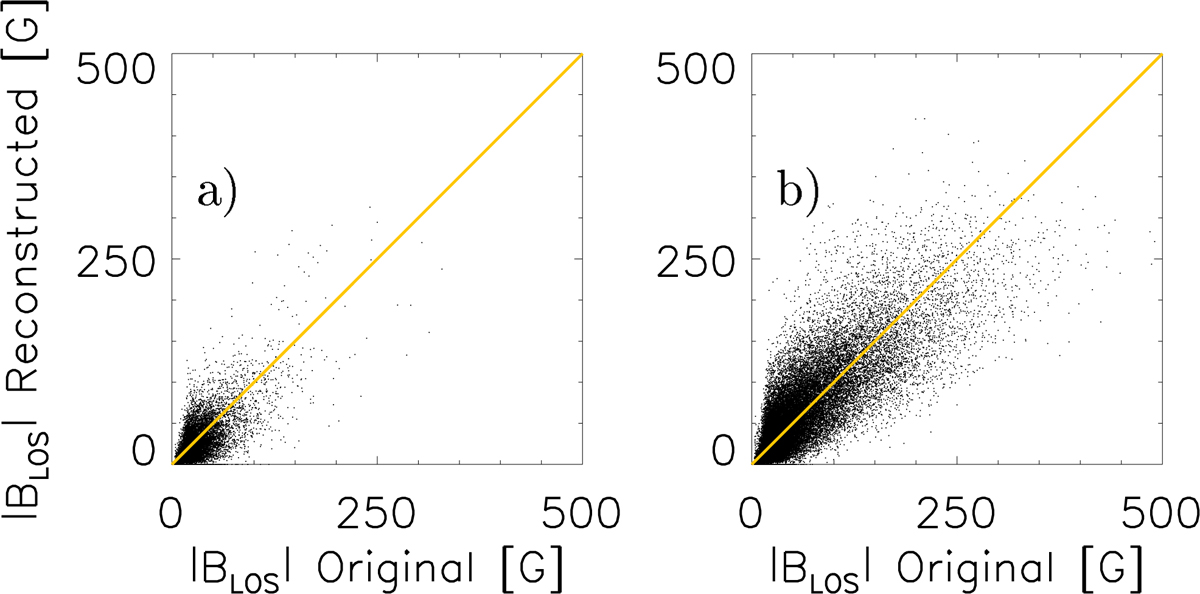
Scatter plots between original (degraded) magnetogram and the reconstructed from the Ca II K image taken on 07/06/2010 (panel a) and 01/04/2011 (panel b) using the average parameters for PFL*. The yellow line has a slope of unity. The axes are shown in the range from the original magnetogram.
Current usage metrics show cumulative count of Article Views (full-text article views including HTML views, PDF and ePub downloads, according to the available data) and Abstracts Views on Vision4Press platform.
Data correspond to usage on the plateform after 2015. The current usage metrics is available 48-96 hours after online publication and is updated daily on week days.
Initial download of the metrics may take a while.