Fig. 12.
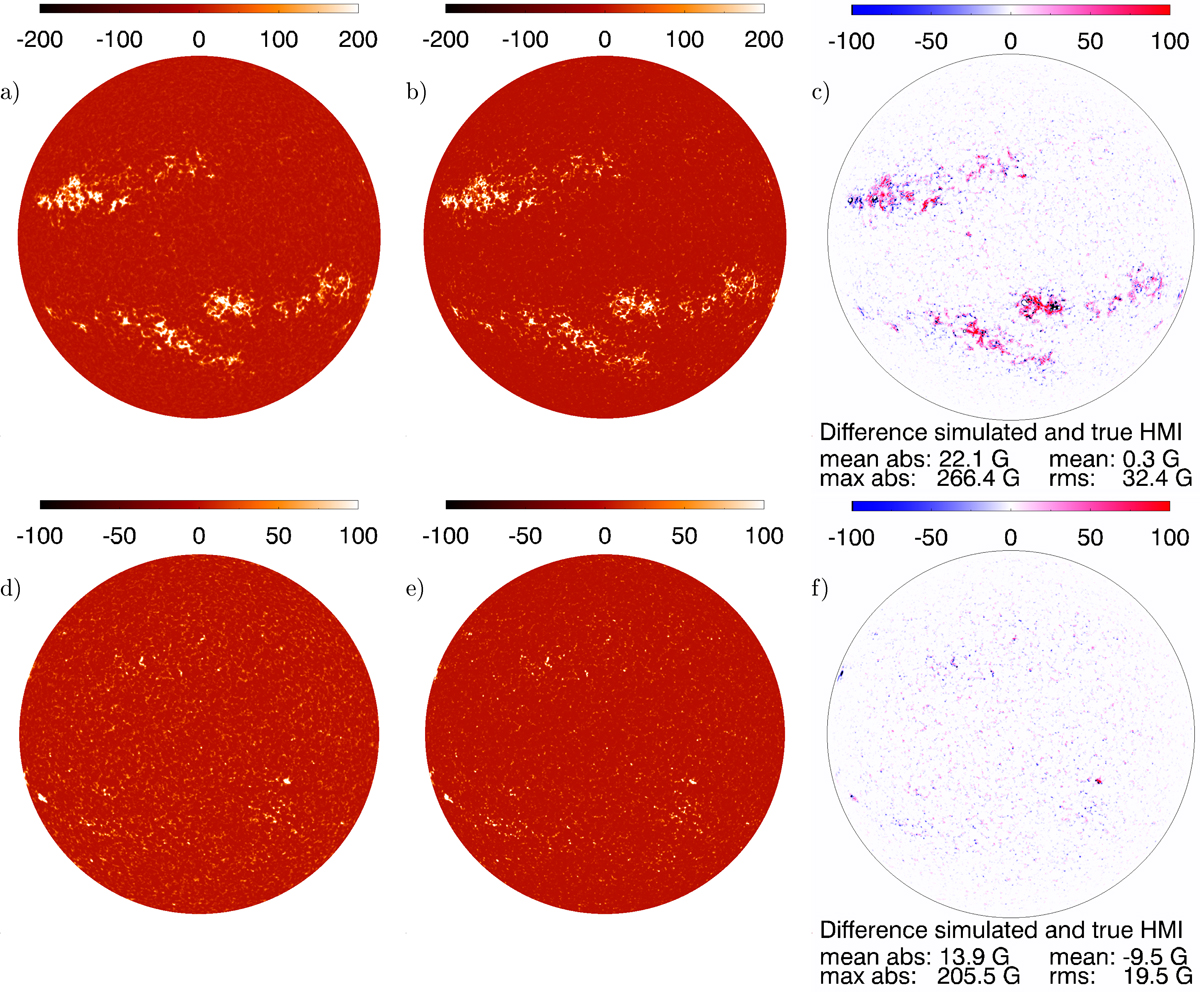
Unsigned magnetograms reconstructed from the Ca II K images taken on 01 April 2011 (top) and 07 June 2010 (bottom) using the average parameters for PFL* (left), SDO/HMI unsigned magnetograms (middle) co-temporal to the Ca II K images, and difference between the reconstructed unsigned magnetogram (simulated) from Ca II K data and the original (true) SDO/HMI unsigned magnetogram (right). The rms, mean, mean absolute, and maximum absolute differences are listed under each panel. The colour bars show the ranges of |BLOS| in G. All images are saturated at 100 G to improve the visibility of the regions with low magnetic field strength.
Current usage metrics show cumulative count of Article Views (full-text article views including HTML views, PDF and ePub downloads, according to the available data) and Abstracts Views on Vision4Press platform.
Data correspond to usage on the plateform after 2015. The current usage metrics is available 48-96 hours after online publication and is updated daily on week days.
Initial download of the metrics may take a while.