Fig. 10.
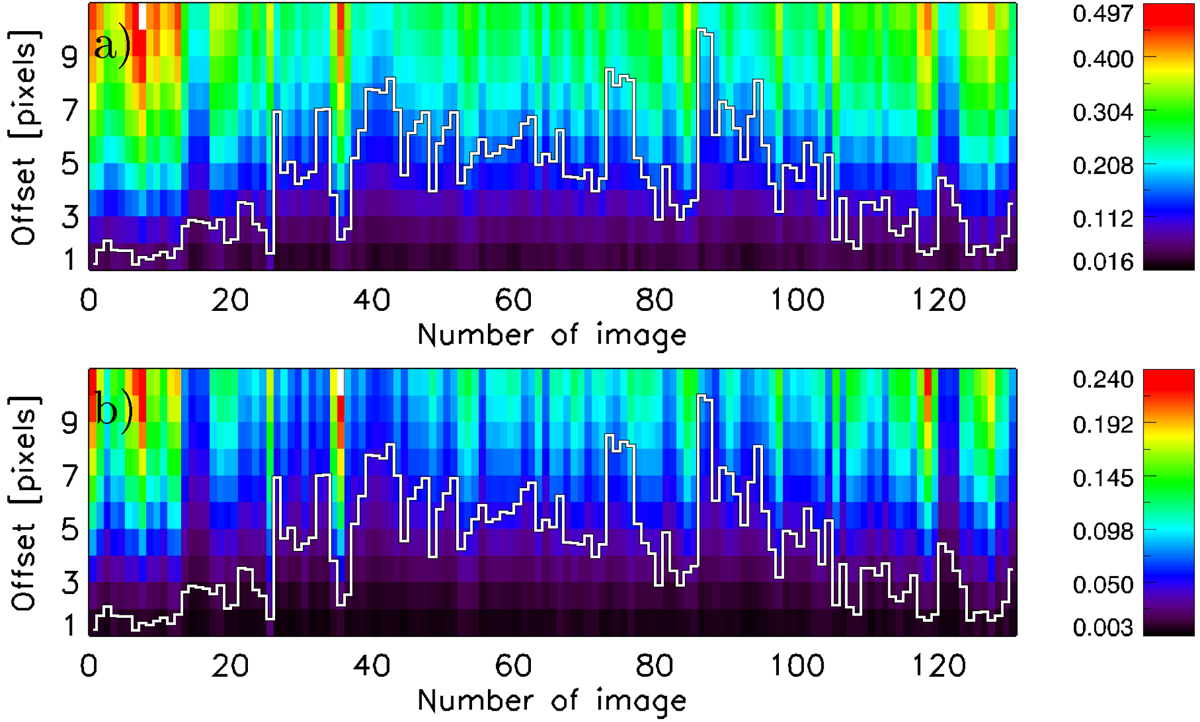
Colour-coded relative errors in the exponent derived with PF (panel a) and PFL* (panel b) due to misalignment of the analysed images. Each Ca II K image was randomly shifted in both x and y directions by up to 10 pixels. The boxes give the average error after 1000 realisations. The y axis gives the value of the maximum possible offset in any direction. The x axis indicates the analysed images ordered by date covering the period 2010–2016. Colour bars show the relative errors in the computed exponents. Over-plotted with white are the plage areas derived from the Ca II K images. The areas were scaled in the range [0,9] and are shown to indicate the activity level.
Current usage metrics show cumulative count of Article Views (full-text article views including HTML views, PDF and ePub downloads, according to the available data) and Abstracts Views on Vision4Press platform.
Data correspond to usage on the plateform after 2015. The current usage metrics is available 48-96 hours after online publication and is updated daily on week days.
Initial download of the metrics may take a while.