Fig. 1.
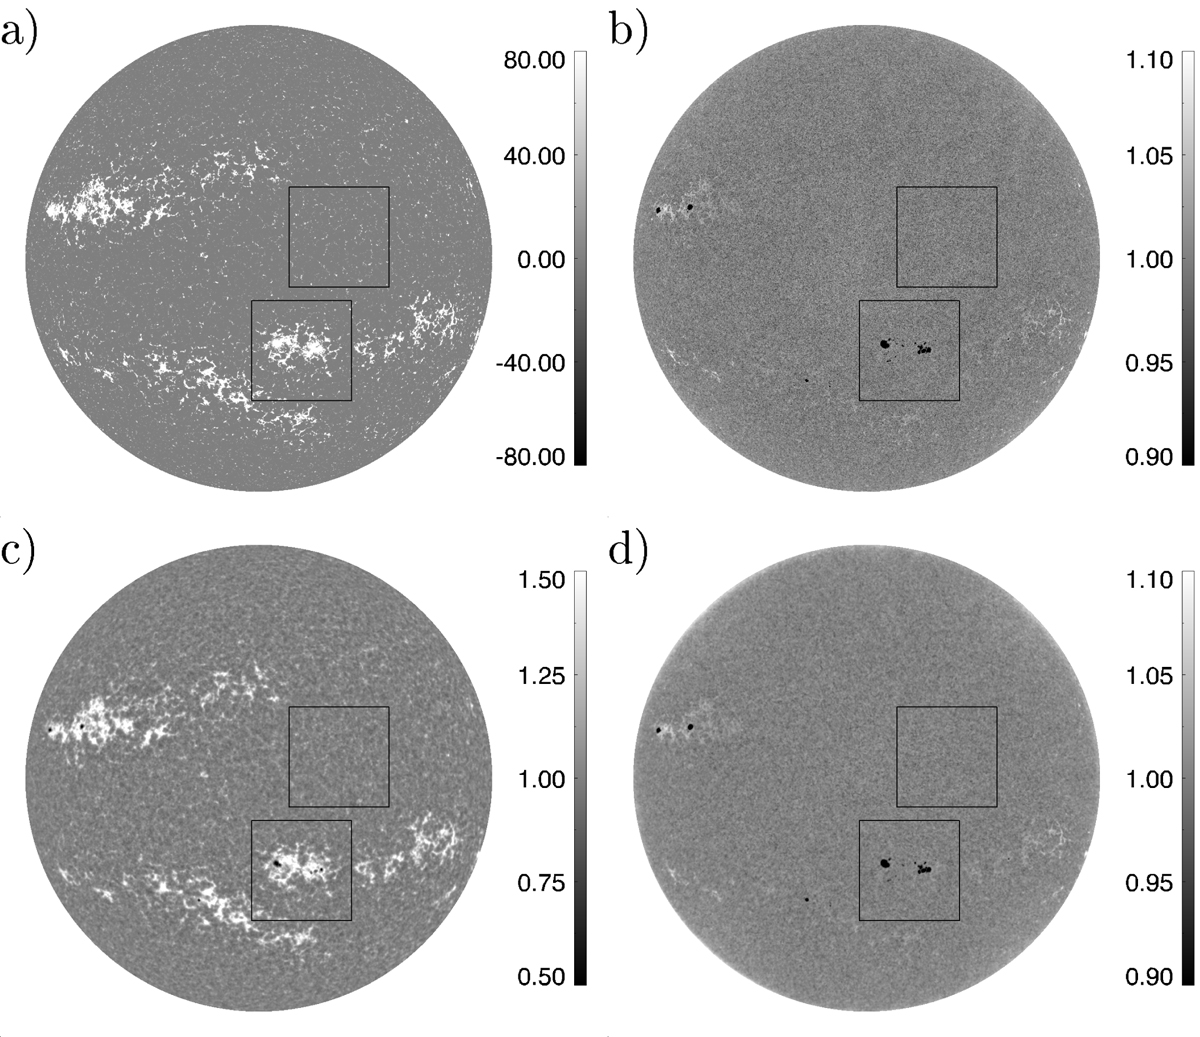
Examples of the observations analysed in this study taken on 01 April 2011 at 09:06:00 UT. Panel a: SDO/HMI unsigned BLOS magnetogram. Panel b: SDO/HMI continuum contrast image (i.e. compensated for intensity CLV). Panel c: Rome/PSPT Ca II K. Panel d: red continuum contrast images. The grey-scale bars on the right-hand side of each panel show magnetic signal in G and contrast, respectively. The squares indicate the insets shown in Fig. A.1.
Current usage metrics show cumulative count of Article Views (full-text article views including HTML views, PDF and ePub downloads, according to the available data) and Abstracts Views on Vision4Press platform.
Data correspond to usage on the plateform after 2015. The current usage metrics is available 48-96 hours after online publication and is updated daily on week days.
Initial download of the metrics may take a while.