Fig. 9.
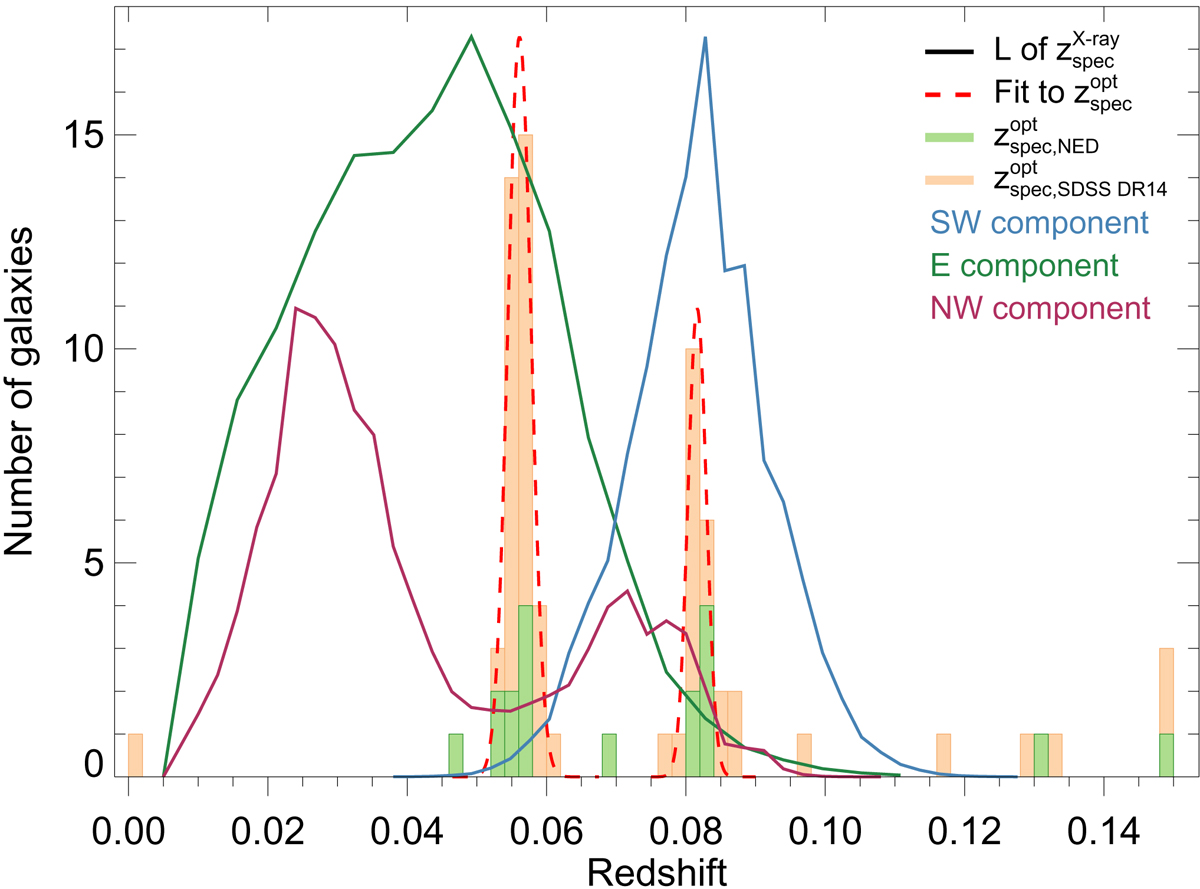
Spectroscopic redshift histogram for galaxies within 30 arcmin of the RXC J0034.6−0208 cluster position. The caption information is the same as for Fig. 8. The Gaussian fit of the low-redshift peak gives z = 0.056 ± 0.002, while the high-redshift structure peaks at z = 0.082 ± 0.001. The likelihood distributions are in green the eastern component, in purple the northwestern object, and in blue the southwestern structure.
Current usage metrics show cumulative count of Article Views (full-text article views including HTML views, PDF and ePub downloads, according to the available data) and Abstracts Views on Vision4Press platform.
Data correspond to usage on the plateform after 2015. The current usage metrics is available 48-96 hours after online publication and is updated daily on week days.
Initial download of the metrics may take a while.