Fig. 7.
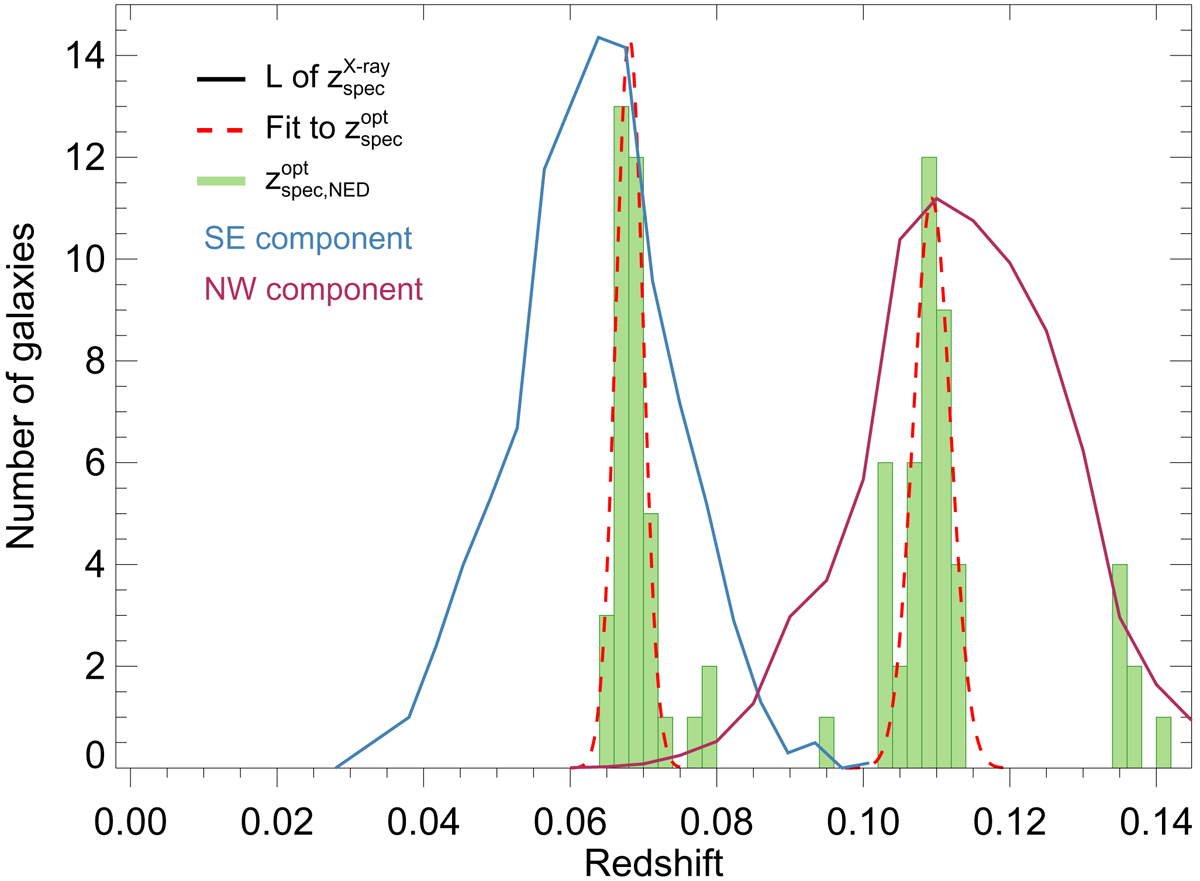
Spectroscopic redshift histogram for galaxies within 30 arcmin of the RXC J2306.6−1319 cluster position. The peaks of this distribution are fitted with Gaussian functions (red dashed lines), obtaining z = 0.068 ± 0.002 for the low-redshift peak and z = 0.109 ± 0.003 for the high-redshift structure. The solid lines show the likelihood distribution of the redshift parameter obtained from the joint X-ray spectral fitting of the two structures shown in Fig. 1. The blue line shows the southeastern component, while the purple one the northwestern object.
Current usage metrics show cumulative count of Article Views (full-text article views including HTML views, PDF and ePub downloads, according to the available data) and Abstracts Views on Vision4Press platform.
Data correspond to usage on the plateform after 2015. The current usage metrics is available 48-96 hours after online publication and is updated daily on week days.
Initial download of the metrics may take a while.