Free Access
Fig. A.1.
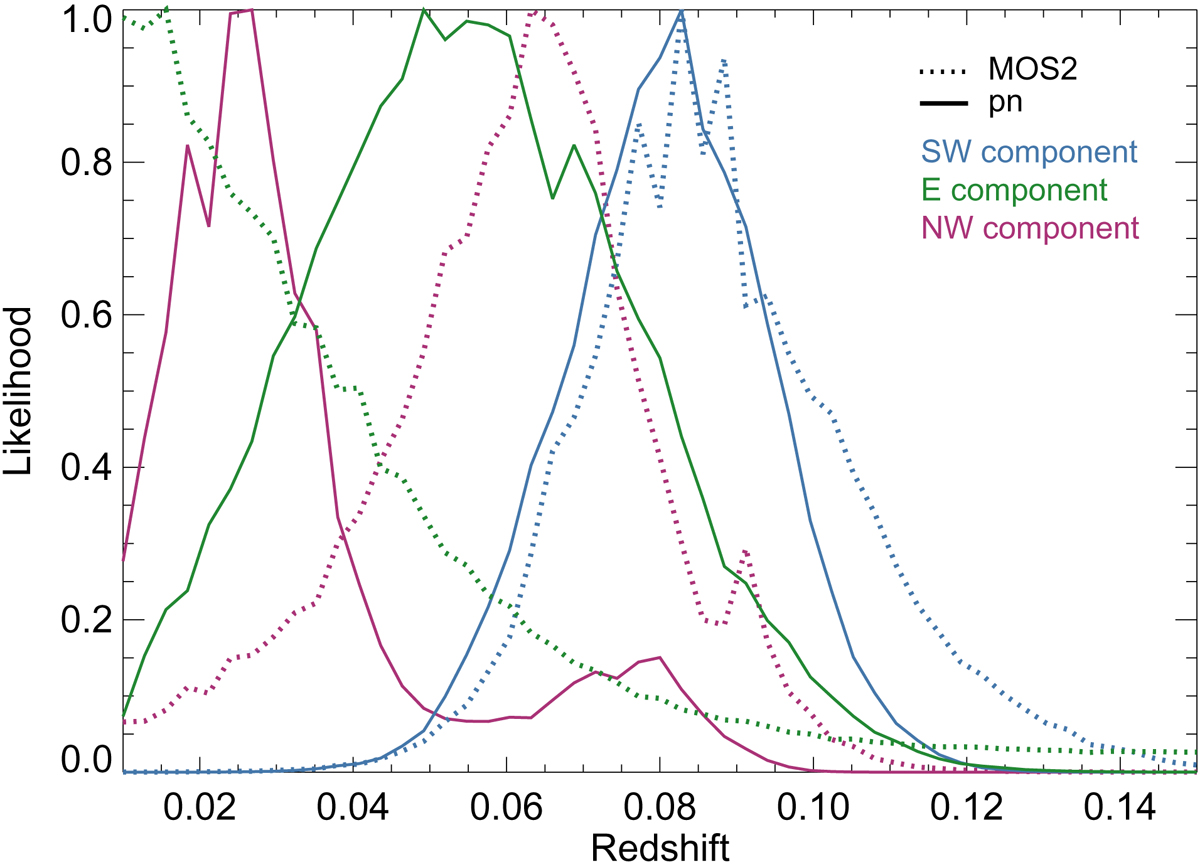
Variation of ℒ as a function of the redshift for the different extended components in the RXC J0034.6−0208 observation. Solid and dotted lines represent the MOS2 and pn detectors, respectively; the blue, green, and purple lines show the results for the southwestern, eastern, and northwestern components, respectively.
Current usage metrics show cumulative count of Article Views (full-text article views including HTML views, PDF and ePub downloads, according to the available data) and Abstracts Views on Vision4Press platform.
Data correspond to usage on the plateform after 2015. The current usage metrics is available 48-96 hours after online publication and is updated daily on week days.
Initial download of the metrics may take a while.