Fig. 12.
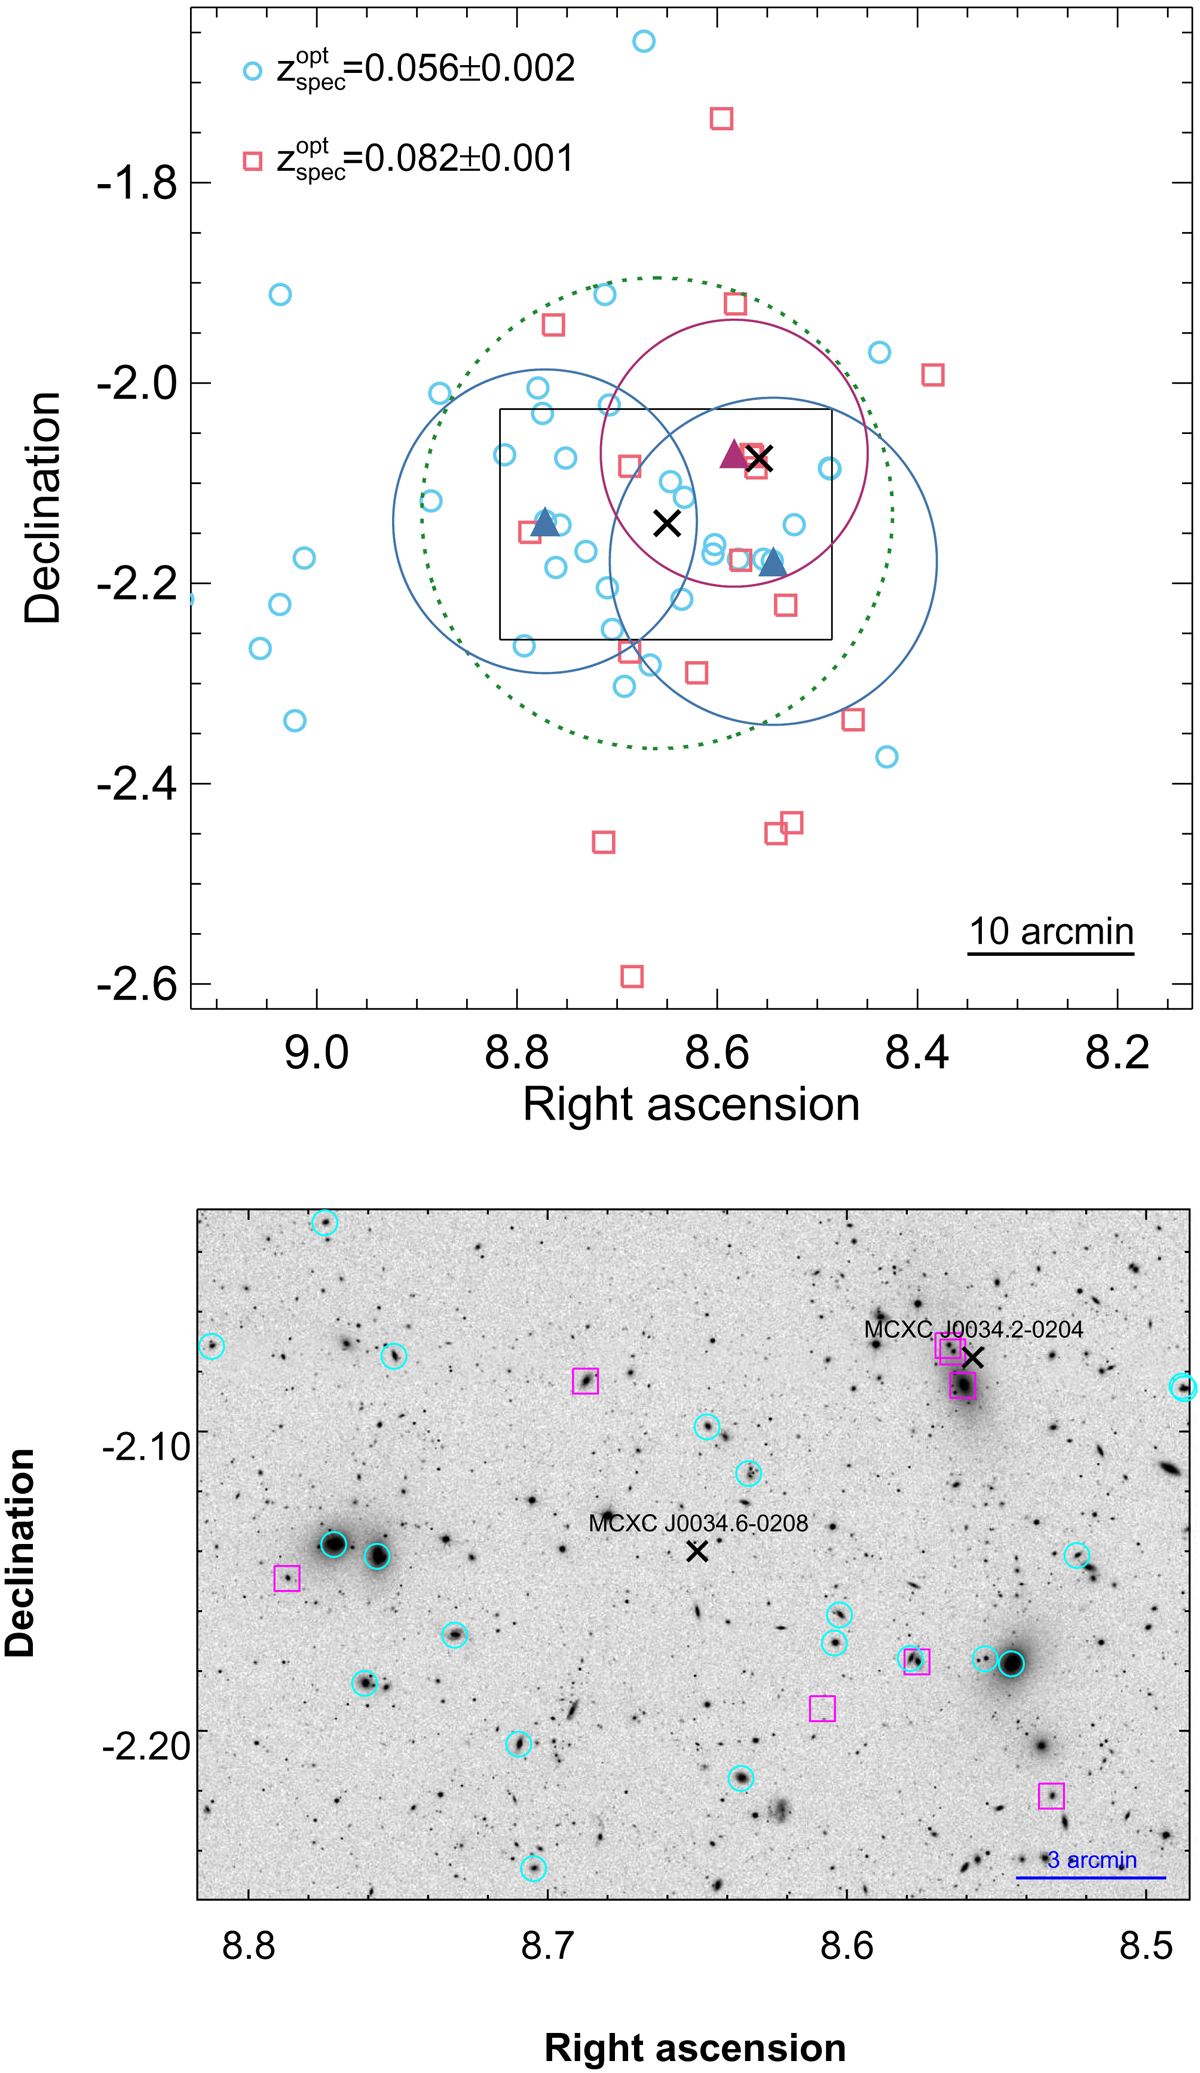
Top: projected redshift distribution of galaxies with spectroscopic redshift information for the RXC J0034.6−0208 observation. The caption information is the same as for Fig. 10, with the exception that light-blue circles correspond to galaxies with redshift values of ∼0.056 and pink squares show galaxies with ∼0.082. The filled triangles shows the X-ray peak positions of the three extended substructures in the field. Bottom: SDSS r -band image of the region delimited by the black solid line in the top panel.
Current usage metrics show cumulative count of Article Views (full-text article views including HTML views, PDF and ePub downloads, according to the available data) and Abstracts Views on Vision4Press platform.
Data correspond to usage on the plateform after 2015. The current usage metrics is available 48-96 hours after online publication and is updated daily on week days.
Initial download of the metrics may take a while.