Fig. 10.
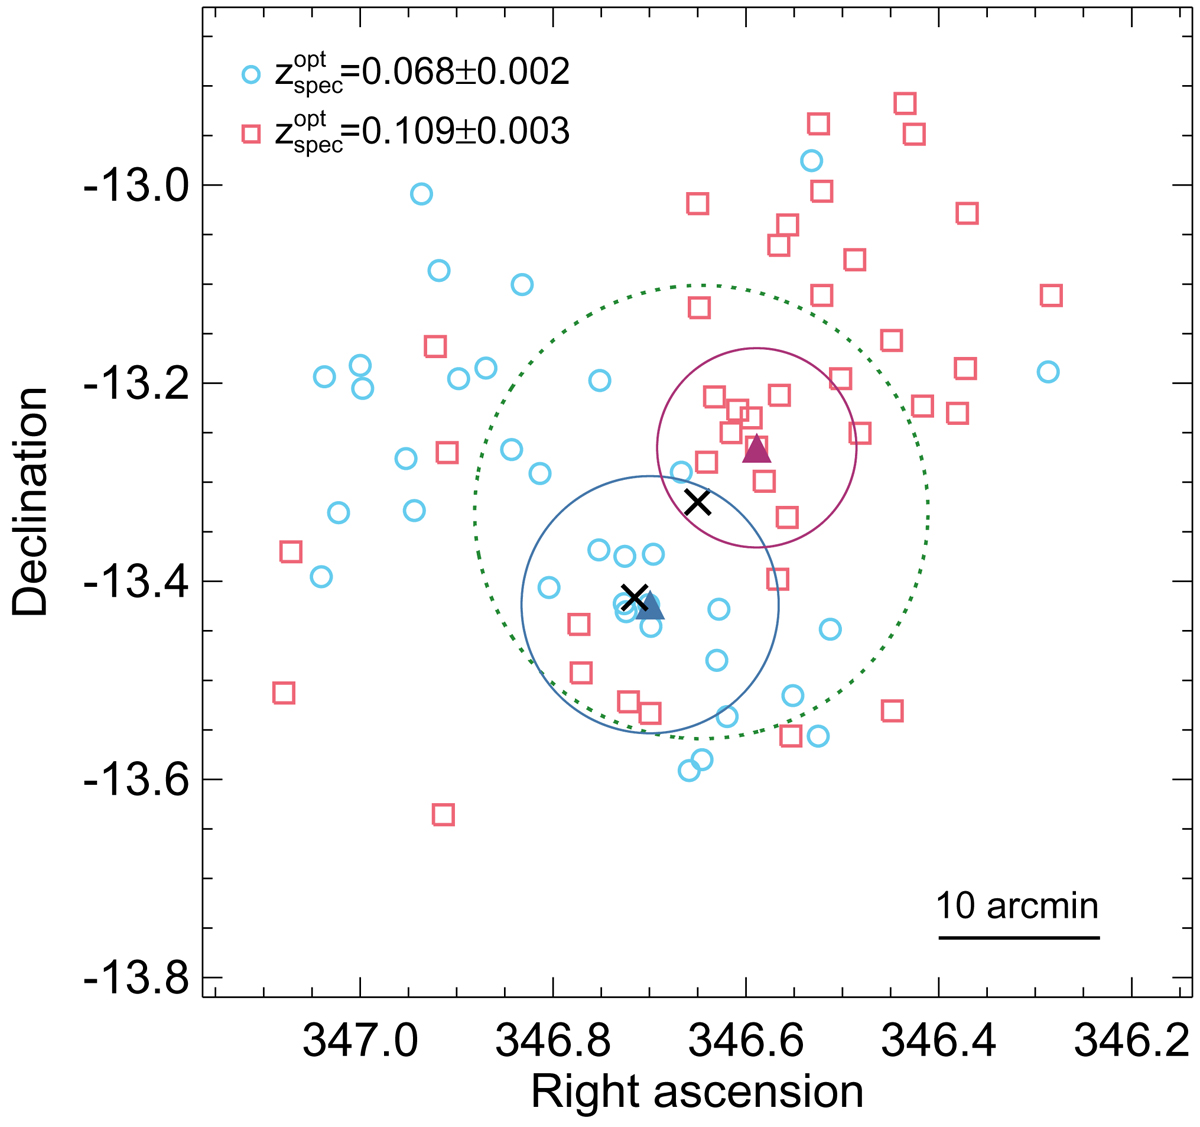
Projected redshift distribution of galaxies with spectroscopic redshift information for the RXC J2306.6−1319 observation. Light-blue circles correspond to galaxies with redshift values of ∼0.068, while pink squares show galaxies with ∼0.109. The black crosses correspond to the position of the MCXC clusters in the observation and the green dotted circle shows the FoV of XMM-Newton (see Fig. 1 for comparison). The purple filled triangle marks the X-ray peak position of A2529, while the blue one of RXC J2306.8−1324. Their corresponding circles show r500. In this figure, north is up and east to the left.
Current usage metrics show cumulative count of Article Views (full-text article views including HTML views, PDF and ePub downloads, according to the available data) and Abstracts Views on Vision4Press platform.
Data correspond to usage on the plateform after 2015. The current usage metrics is available 48-96 hours after online publication and is updated daily on week days.
Initial download of the metrics may take a while.