Fig. 7.
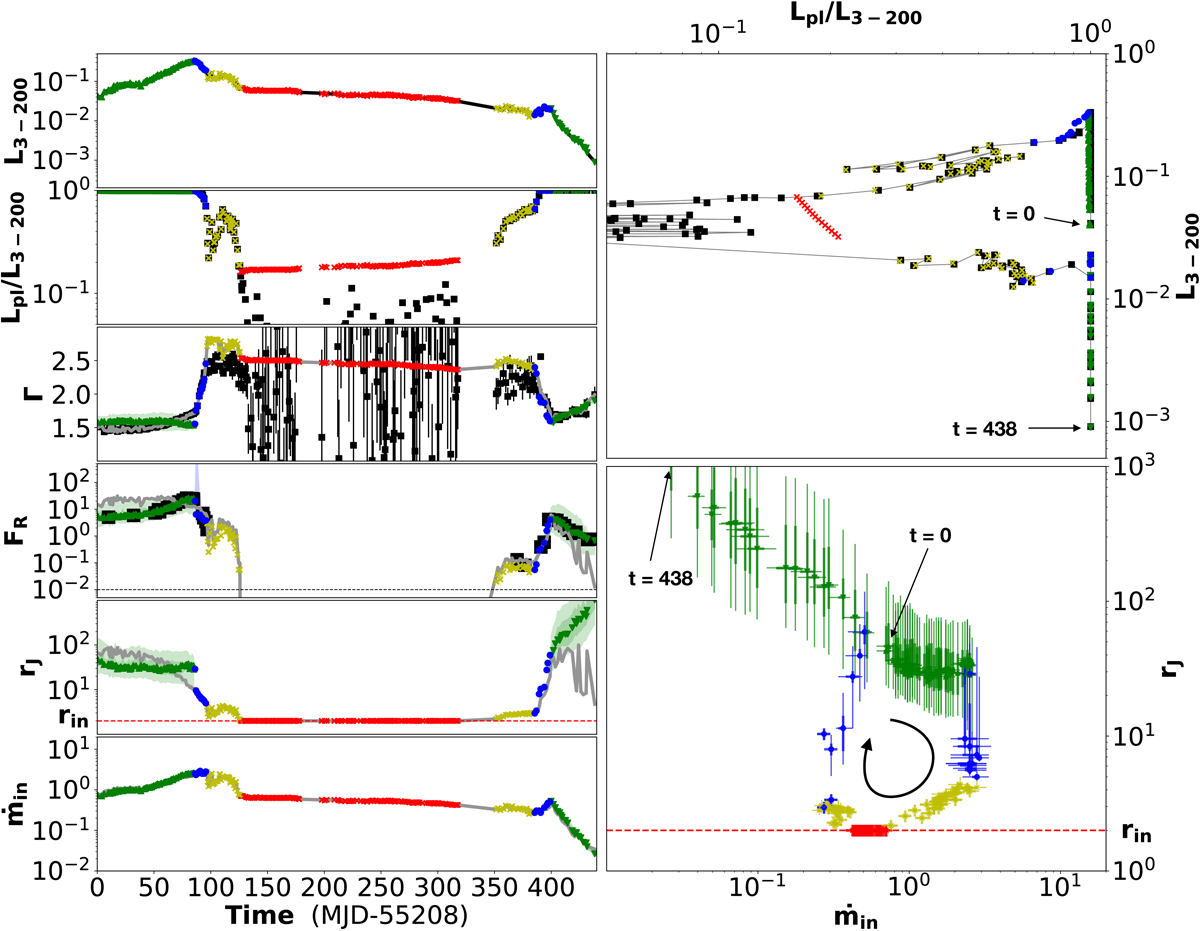
2010–2011 outburst of GX 339-4, derived using the fitting procedure B that takes into account X-rays and radio constraints. On the left, from top to bottom, light curves of 3–200 keV flux (in Eddington units), power-law fraction, power-law index, radio flux FR (in mJy), transition radius rJ, and accretion rate ṁin. Light curves of the same quantities, but obtained using procedure A (Fig. 3), are also reported with gray lines for comparison. On the right, evolutionary tracks in the associated DFLD (top) and in an rJ(ṁin)-diagram (bottom), in which the starting and ending positions are indicated. The color code is the same as previously: green triangles for the hard state, blue circles for the hard-intermediate, yellow crosses for the soft-intermediate, and red crosses for the soft state. Different symbols were used for the two phases of the hard state to better distinguish them: Upper triangles are used for the rising phase and lower triangles for the decaying phase. Error bars for the 5% and 10% confidence intervals are also displayed in the bottom right panel.
Current usage metrics show cumulative count of Article Views (full-text article views including HTML views, PDF and ePub downloads, according to the available data) and Abstracts Views on Vision4Press platform.
Data correspond to usage on the plateform after 2015. The current usage metrics is available 48-96 hours after online publication and is updated daily on week days.
Initial download of the metrics may take a while.