Open Access
Fig. 4.
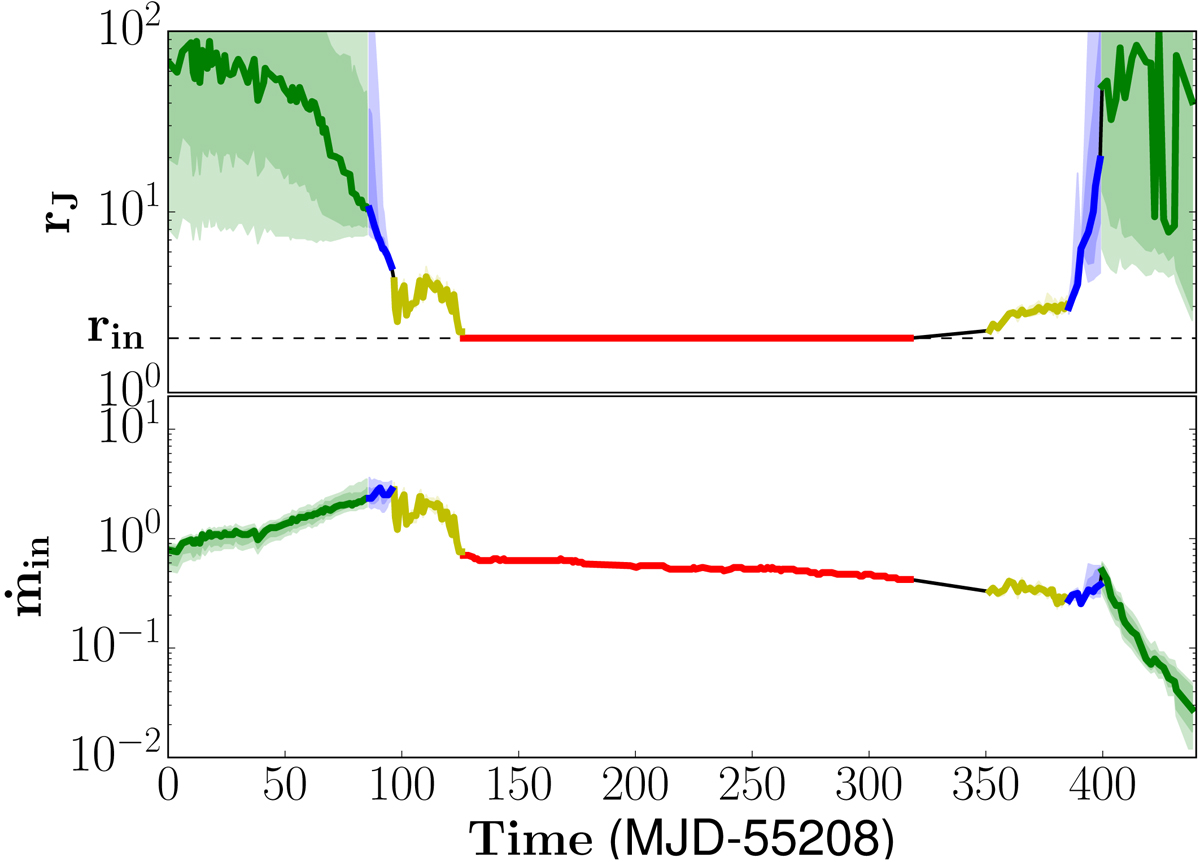
Time evolution of rJ (top) and ṁin (down) associated with the best ζX defined by Eq. (1). The color code is the same as previously. The transparent colored areas correspond to the confidence intervals of 5% and 10% error margin (see text).
Current usage metrics show cumulative count of Article Views (full-text article views including HTML views, PDF and ePub downloads, according to the available data) and Abstracts Views on Vision4Press platform.
Data correspond to usage on the plateform after 2015. The current usage metrics is available 48-96 hours after online publication and is updated daily on week days.
Initial download of the metrics may take a while.