Fig. 3.
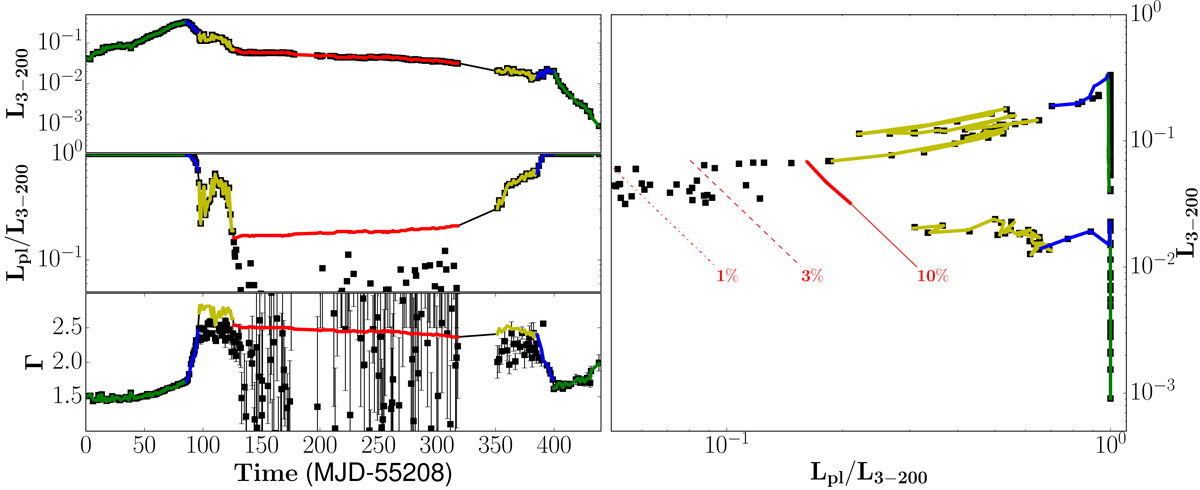
Results of fitting procedure A applied to the 2010–2011 outburst of GX 339-4. The black markers are fits taken from Clavel et al. (2016) reported with their error bars when reliable, while color lines display our results: green, blue, yellow, and red for hard, hard-intermediate, soft-intermediate, and soft states, respectively (see Sect. 2). Left, from top to bottom: 3–200 keV total luminosity L3−200 (in Eddington units), the power-law luminosity fraction PLf = Lpl/L3−200, and the power-law index Γ. Right: DFLD. The hard tail proxy we used was frozen to 10%, but 1% and 3% proxies are also illustrated as red dot-dashed and dashed lines (see Paper III).
Current usage metrics show cumulative count of Article Views (full-text article views including HTML views, PDF and ePub downloads, according to the available data) and Abstracts Views on Vision4Press platform.
Data correspond to usage on the plateform after 2015. The current usage metrics is available 48-96 hours after online publication and is updated daily on week days.
Initial download of the metrics may take a while.