Fig. 1.
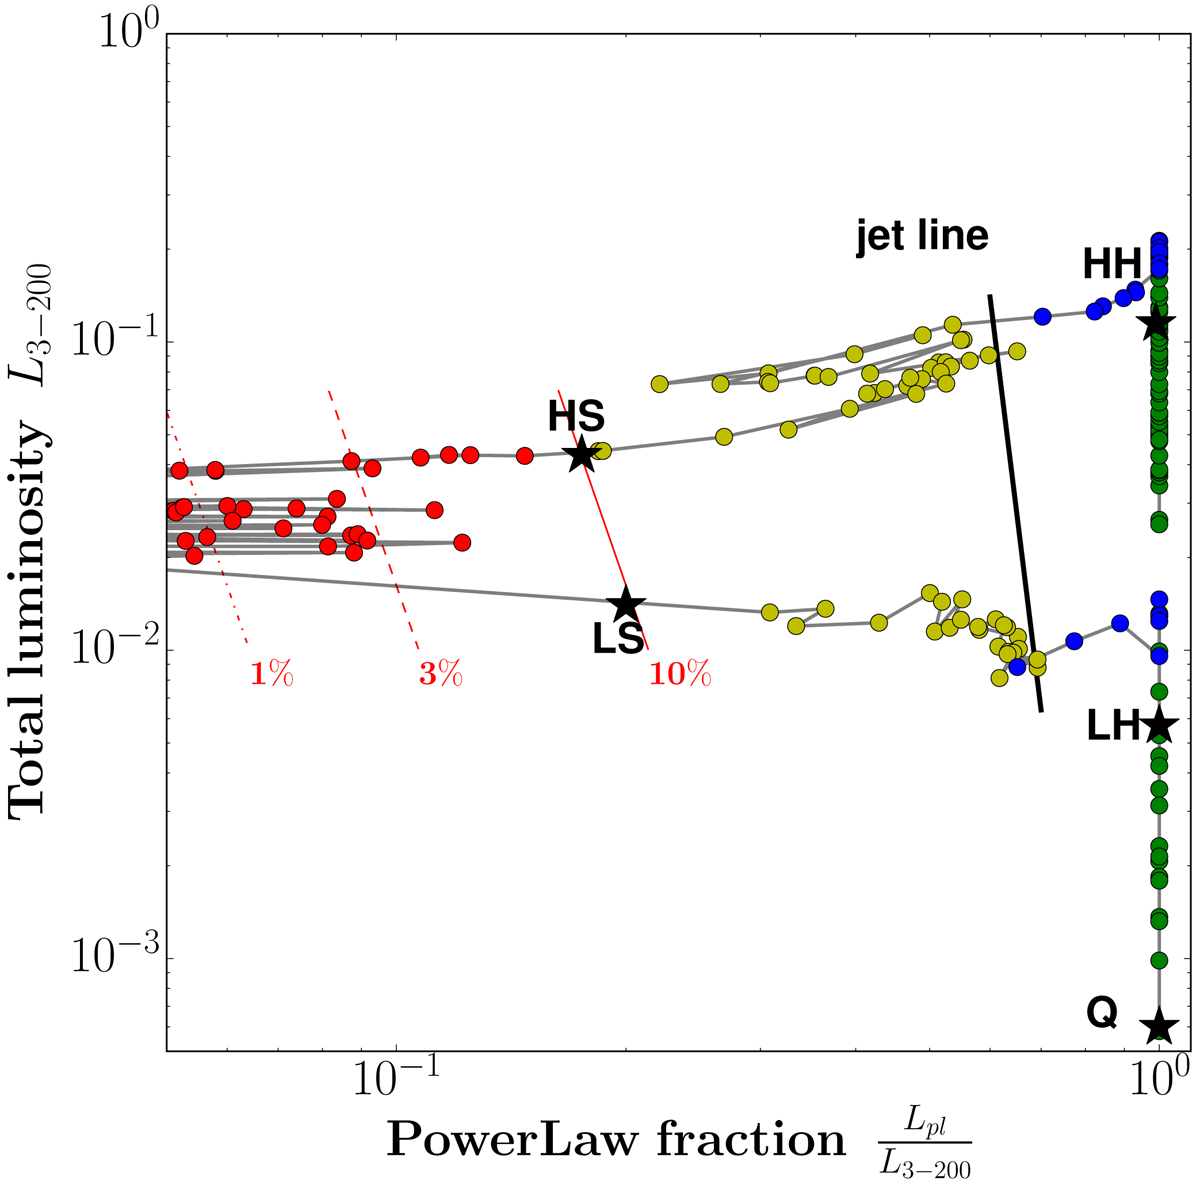
Evolution of GX 339-4 during its 2010–2011 outburst in a 3–200 keV DFLD, showing the total L3−200 X-ray luminosity (in Eddington units) as a function of the power-law fraction. Hard states are displayed in green, hard-intermediate states in blue, soft-intermediate states in yellow, and soft states in red (see text). The five canonical states (Q, LH, HH, HS, and LS) defined in Paper III are highlighted by the black stars, and the observed approximate location of the jet-line is illustrated as a black line. Hard tail levels of 1, 3, and 10% are shown as red dotted, dashed, and solid lines, respectively (see text).
Current usage metrics show cumulative count of Article Views (full-text article views including HTML views, PDF and ePub downloads, according to the available data) and Abstracts Views on Vision4Press platform.
Data correspond to usage on the plateform after 2015. The current usage metrics is available 48-96 hours after online publication and is updated daily on week days.
Initial download of the metrics may take a while.