Fig. 8.
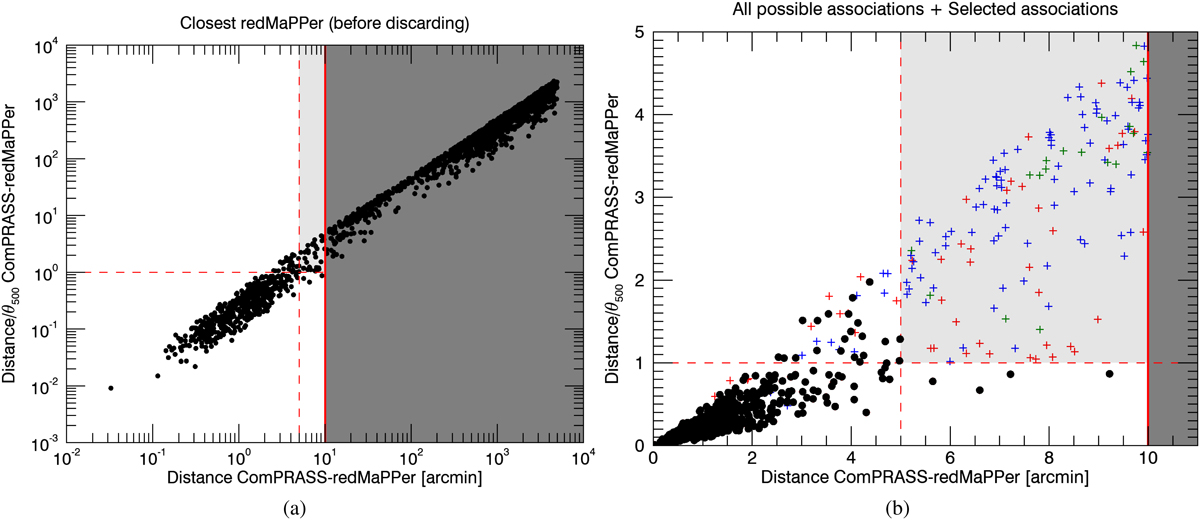
Positional criteria for matching ComPRASS candidates to redMaPPer clusters. Panel a: closest redMaPPer cluster to each ComPRASS candidate. Panel b: all the possible redMaPPer counterparts within 10 arcmin of each ComPRASS candidate. Red, blue, and green symbols represent the closest, second-closest, and third-closest counterpart (if it exists), respectively. The black circles identify the pairs that are finally selected. The blue and red coloured crosses in the d < 5 region correspond to associations that satisfy the positional criteria, but that are finally discarded by the richness cut.
Current usage metrics show cumulative count of Article Views (full-text article views including HTML views, PDF and ePub downloads, according to the available data) and Abstracts Views on Vision4Press platform.
Data correspond to usage on the plateform after 2015. The current usage metrics is available 48-96 hours after online publication and is updated daily on week days.
Initial download of the metrics may take a while.