Fig. 5.
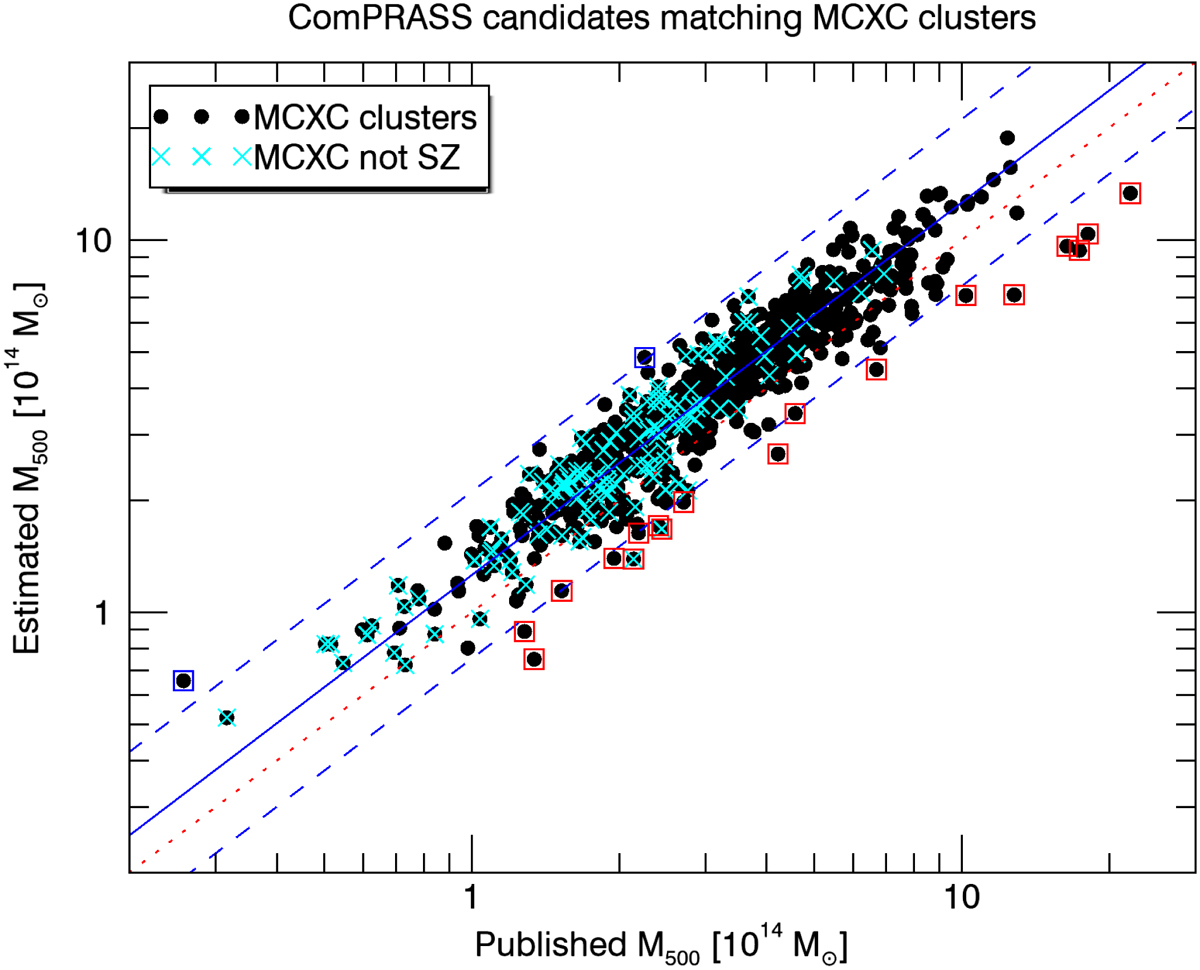
M500 estimated from the joint detection for the 696 ComPRASS candidates matching a confirmed MCXC cluster vs. the published M500 of the corresponding cluster. The dotted red line indicates the line of zero intercept and unity slope. The solid blue line indicates the median ratio. The dashed blue lines indicate the interval of ±2.5σ around the median ratio. Outliers are highlighted with a blue (high estimated mass) or red (low estimated mass) square; see text. Cyan crosses indicate MCXC clusters that are not in Planck or SPT.
Current usage metrics show cumulative count of Article Views (full-text article views including HTML views, PDF and ePub downloads, according to the available data) and Abstracts Views on Vision4Press platform.
Data correspond to usage on the plateform after 2015. The current usage metrics is available 48-96 hours after online publication and is updated daily on week days.
Initial download of the metrics may take a while.