Fig. 12.
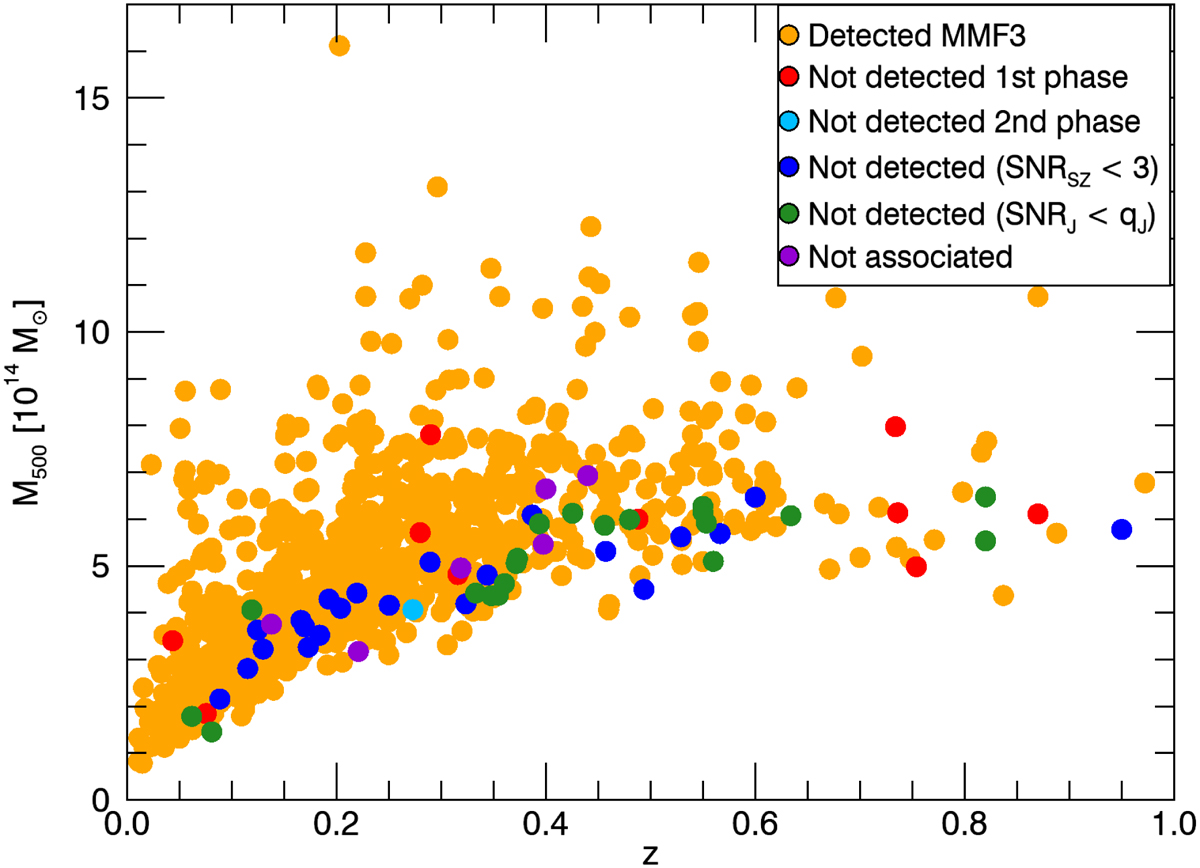
Mass and redshift of confirmed clusters in the MMF3 catalogue. Yellow-filled circles represent MMF3 clusters that are detected by the joint detection algorithm; red-filled circles represent MMF3 clusters that were lost in the first phase of the algorithm; the light blue filled circle represents the MMF3 cluster that was lost in the second phase of the algorithm; dark blue filled circles represent MMF3 clusters detected in the second phase of the algorithm, but discarded due to a low (S/N)SZ; and green-filled circles represent MMF3 clusters detected in the second phase of the algorithm, but discarded because the joint S/N was not high enough.
Current usage metrics show cumulative count of Article Views (full-text article views including HTML views, PDF and ePub downloads, according to the available data) and Abstracts Views on Vision4Press platform.
Data correspond to usage on the plateform after 2015. The current usage metrics is available 48-96 hours after online publication and is updated daily on week days.
Initial download of the metrics may take a while.