Fig. 11.
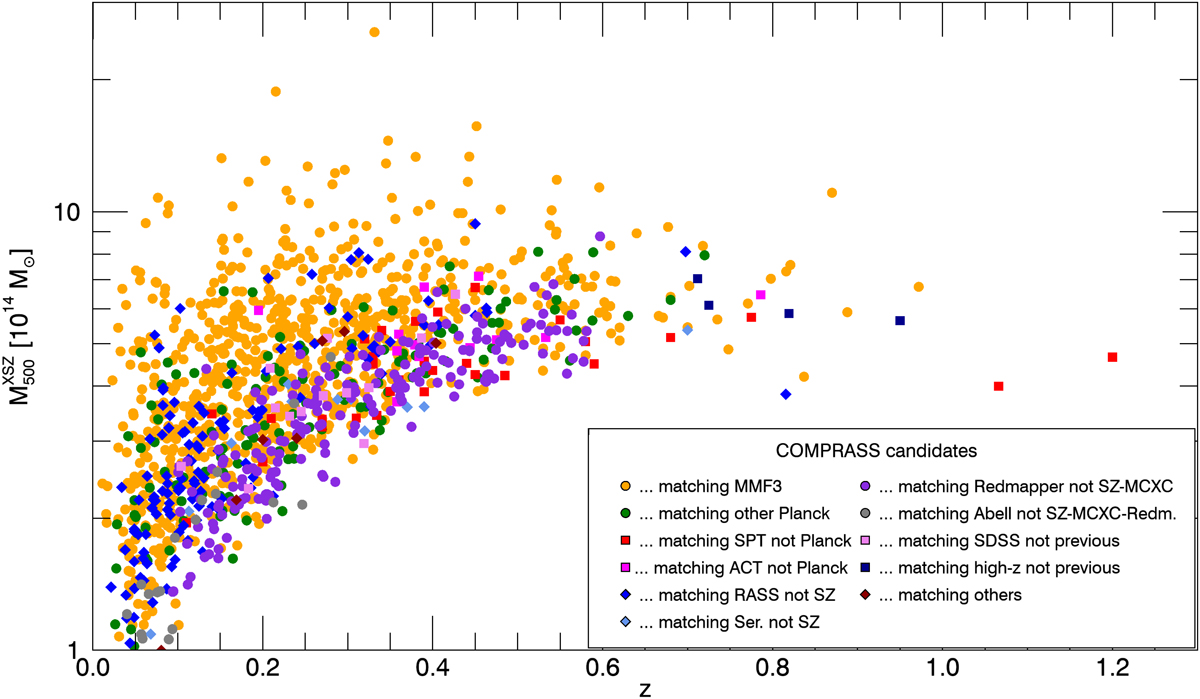
Distribution in the M500 − z plane of validated ComPRASS candidates. Each candidate is colour-coded according to its associated cluster. Yellow circles represent ComPRASS candidates matching confirmed MMF3 clusters, green circles represent ComPRASS candidates matching other confirmed Planck clusters (not MMF3), red squares represent ComPRASS candidates matching confirmed SPT clusters not detected by Planck, magenta squares represent ComPRASS candidates matching confirmed ACT clusters not detected by Planck or SPT, blue diamonds represent ComPRASS candidates matching confirmed MCXC clusters that do not match any of the previously mentioned catalogues (dark blue for RASS, light blue for serendipitous), purple circles correspond to candidates matching redMaPPer clusters not in SZ or MCXC catalogues, grey circles correspond to candidates matching an Abell cluster not in the previous catalogues, pink squares correspond to candidates matching other SDSS clusters not in the previous catalogues, dark blue squares correspond to candidates matching other high-redshift clusters from Wen & Han (2018) and Buddendiek et al. (2015) not in the previous catalogues, and dark red diamonds correspond to candidates matching the additional clusters found in NED and SIMBAD databases. The mass is estimated from the X-SZ signal and the cluster z as described in Sect. 2.3.
Current usage metrics show cumulative count of Article Views (full-text article views including HTML views, PDF and ePub downloads, according to the available data) and Abstracts Views on Vision4Press platform.
Data correspond to usage on the plateform after 2015. The current usage metrics is available 48-96 hours after online publication and is updated daily on week days.
Initial download of the metrics may take a while.