Fig. 8.
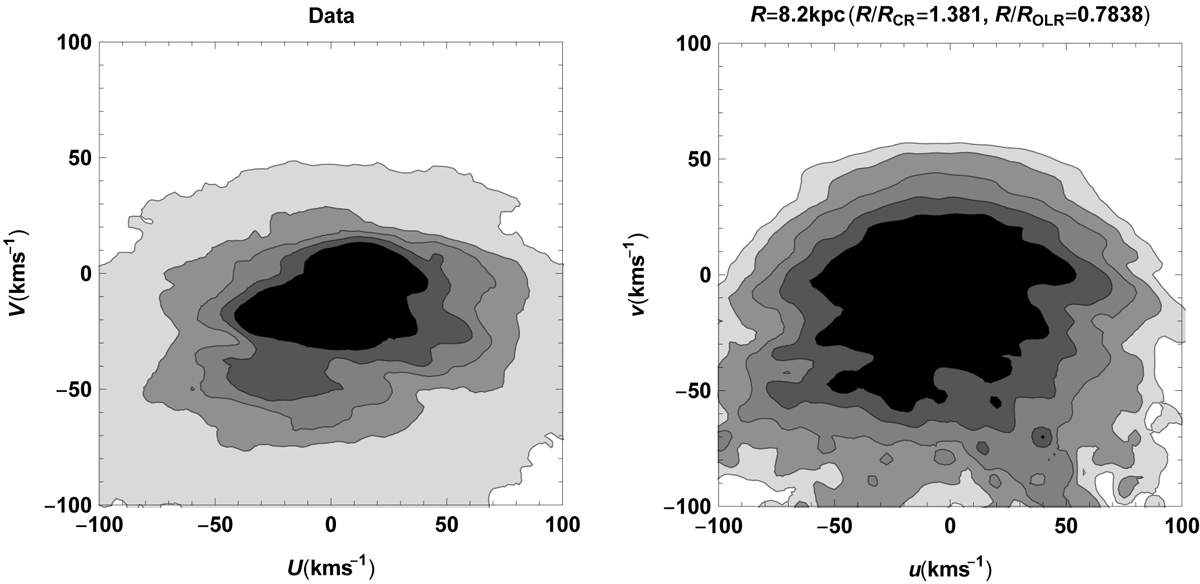
Left panel: observed local velocity UV plane for Gaia DR2 stars inside a spherical volume of radius 0.2 kpc, with the distances estimated by Bailer-Jones et al. (2018). The contours include (from darkest to lightest) 50, 68, 80, 90, and 99% of the stars. Right panel: (u, v) velocity distribution at the Sun obtained with the backward integrations discussed in Sect. 5 for the P17 model, i.e. the central panel (top row) of Fig. 7. In this case the contours include (from darkest to lightest) 50, 68, 80, 90, and 95% of the stars.
Current usage metrics show cumulative count of Article Views (full-text article views including HTML views, PDF and ePub downloads, according to the available data) and Abstracts Views on Vision4Press platform.
Data correspond to usage on the plateform after 2015. The current usage metrics is available 48-96 hours after online publication and is updated daily on week days.
Initial download of the metrics may take a while.