Fig. 8.
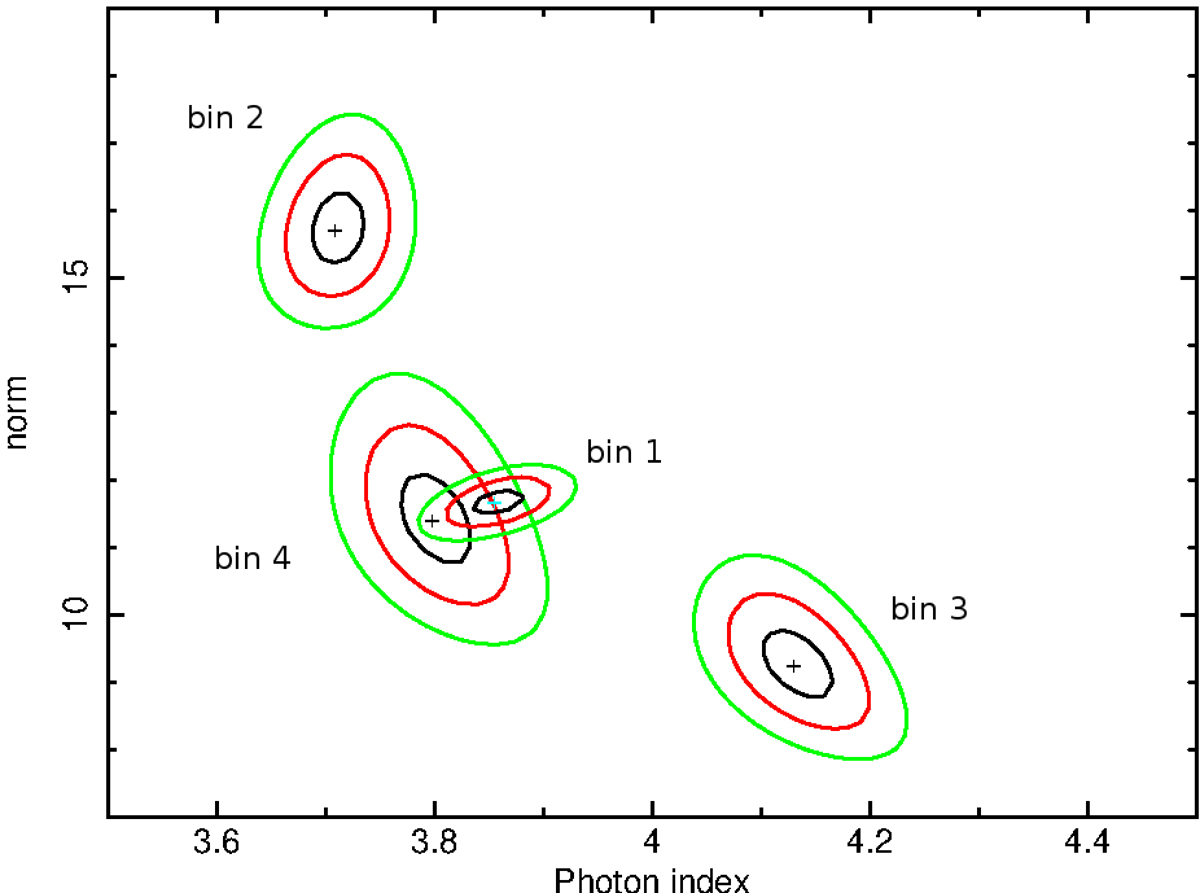
Contour plots for the 1, 2, and 3σ contours of the values of photon index and normalization (unabsorbed flux in the 2−10 keV band in units of 10−12 erg s−1 cm−2 divided by the constant factors reported in Table 2) of the power-law component of the best-fit model (const*gabs*TBabs*(pegpwrlw+bbodyrad)) for the four phase bins used in the phase-resolved spectroscopy.
Current usage metrics show cumulative count of Article Views (full-text article views including HTML views, PDF and ePub downloads, according to the available data) and Abstracts Views on Vision4Press platform.
Data correspond to usage on the plateform after 2015. The current usage metrics is available 48-96 hours after online publication and is updated daily on week days.
Initial download of the metrics may take a while.