Fig. 5.
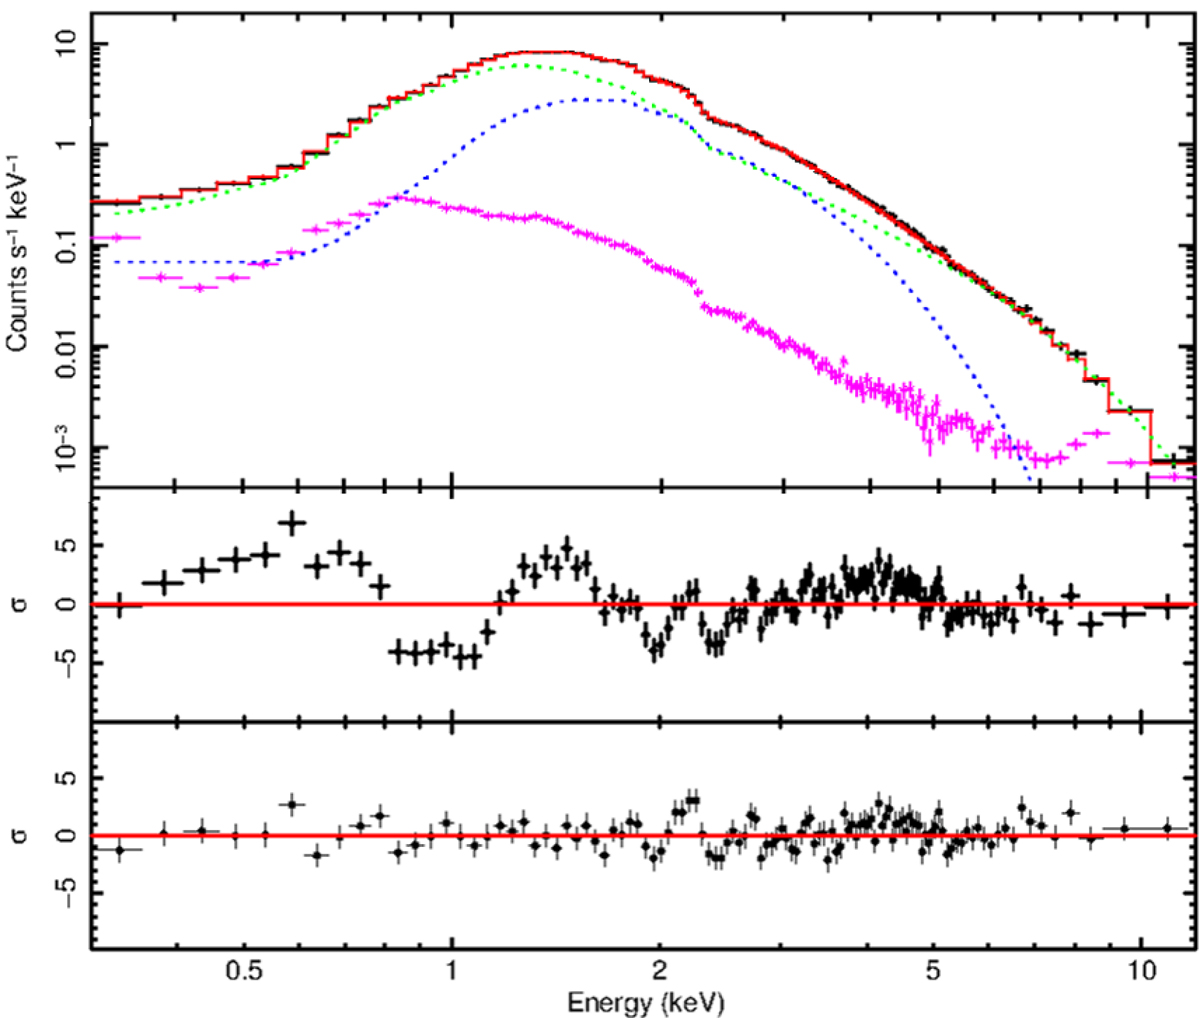
Upper panel: results of the best fit for the EPIC PN phase-averaged spectrum of observation C (red line) obtained with a gabs*TBabs*(pegpwrlw + bbodyrad) model. The blackbody (blue line) and power-law (green line) components are plotted, as well as the spectrum of the background (magenta). Lower panels: residuals (in standard deviation units) for the best fit obtained without (top) and with (bottom) the gabs component. A factor 10 graphic rebin is used.
Current usage metrics show cumulative count of Article Views (full-text article views including HTML views, PDF and ePub downloads, according to the available data) and Abstracts Views on Vision4Press platform.
Data correspond to usage on the plateform after 2015. The current usage metrics is available 48-96 hours after online publication and is updated daily on week days.
Initial download of the metrics may take a while.