Fig. 4.
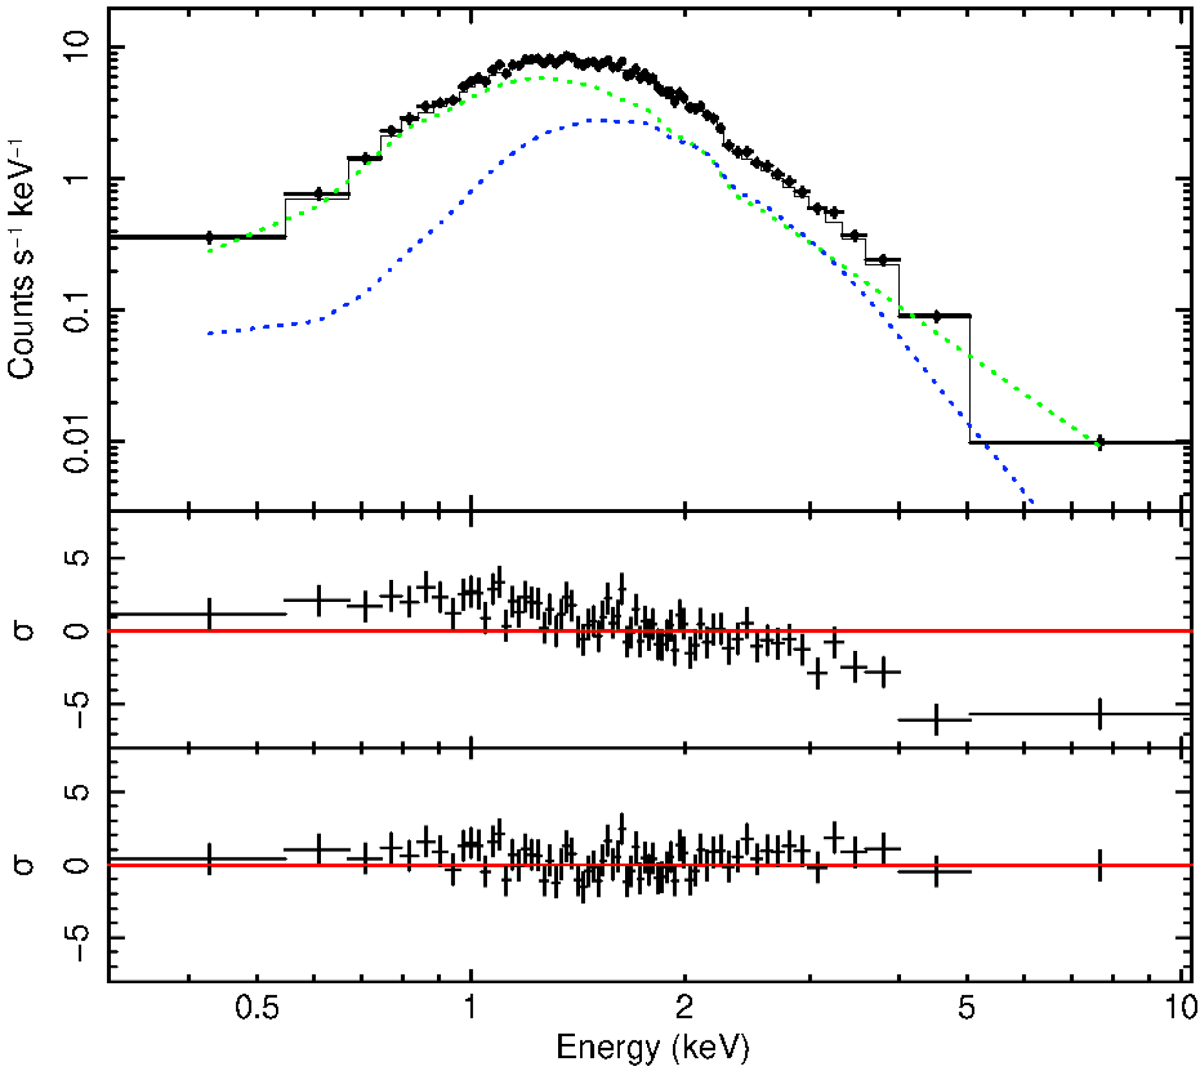
Example of a spectral fit in one of the 50 phase bins we used for the phase-resolved spectroscopy. This is one of the bins located inside the bars of the V-shaped feature. Upper panel: results of the best fit for the const*cyclabs*gabs*TBabs*(pegpwrlw + bbodyrad) model (best-fit model for the phase-averaged spectrum plus a cyclotron absorption line) to the EPIC PN spectrum. The blackbody (blue line) and power-law (green line) components are plotted. Lower panels: residuals (in standard deviation units) for the best fit obtained without (χ2 = 539.2 for 347 d.o.f., null hypothesis probability ≃10−10), and with (χ2 = 360.2 for 344 d.o.f., null hypothesis probability = 0.26) the cyclotron absorption line. The best-fit parameters for the cyclotron absorption line are E = 1.0 keV and width W = 4.0 keV. A factor 5 graphic rebin is used.
Current usage metrics show cumulative count of Article Views (full-text article views including HTML views, PDF and ePub downloads, according to the available data) and Abstracts Views on Vision4Press platform.
Data correspond to usage on the plateform after 2015. The current usage metrics is available 48-96 hours after online publication and is updated daily on week days.
Initial download of the metrics may take a while.