Fig. 3.
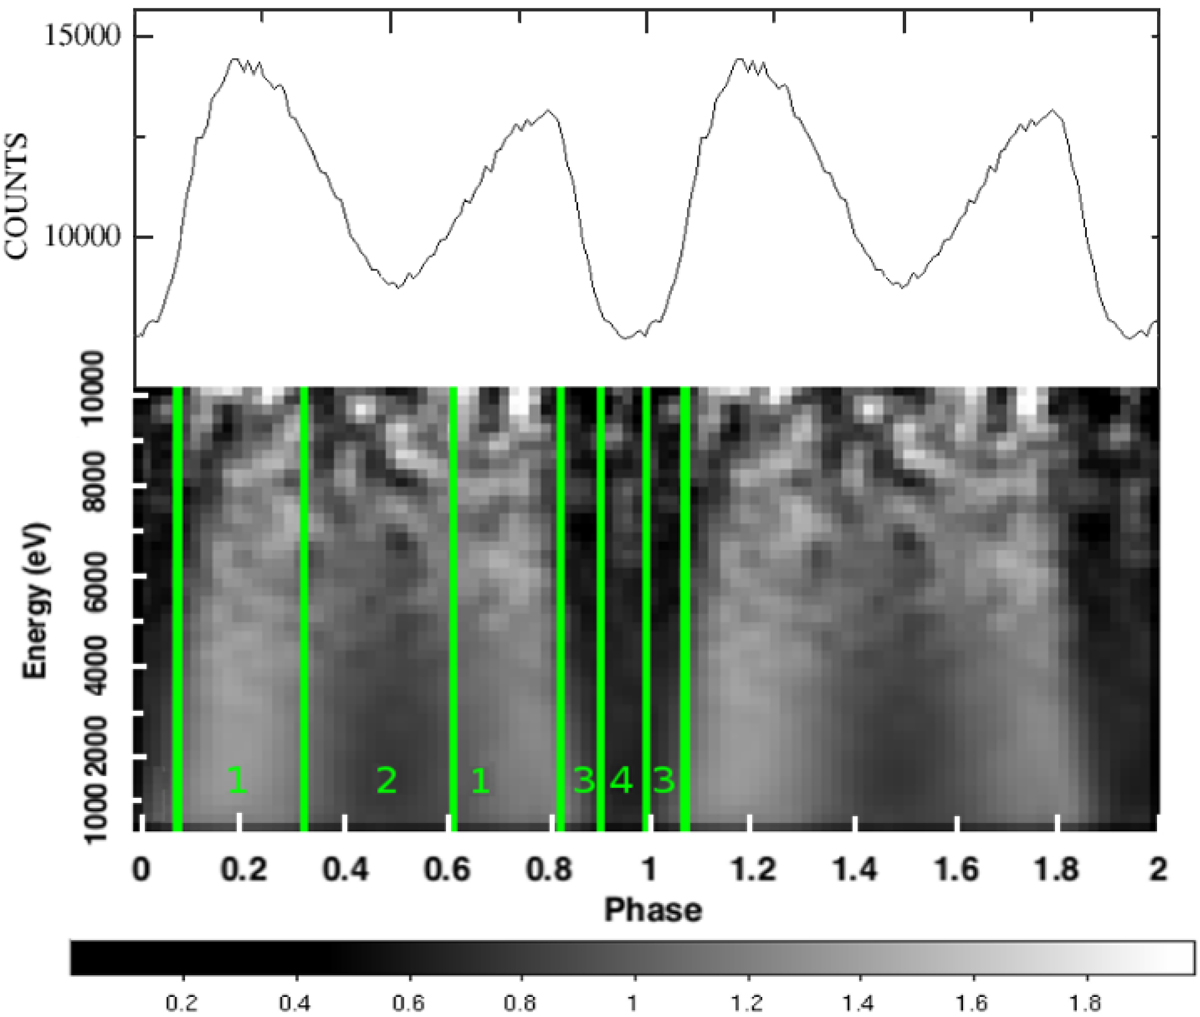
Top: EPIC PN light curve in the energy range 0.3−12.0 keV for observation C. The double-peak pulse profile is clearly visible. Bottom: phase-energy diagram for the EPIC PN data obtained by binning the source counts into energy and rotational phase channels, then normalizing to the phase-averaged energy spectrum for the same observation (same as in Fig. 2, but not normalized to the energy-integrated pulse profile). The four phase bins used for the phase-resolved spectroscopy on the EPIC spectrum are identified by the green bars and numbers.
Current usage metrics show cumulative count of Article Views (full-text article views including HTML views, PDF and ePub downloads, according to the available data) and Abstracts Views on Vision4Press platform.
Data correspond to usage on the plateform after 2015. The current usage metrics is available 48-96 hours after online publication and is updated daily on week days.
Initial download of the metrics may take a while.