Free Access
Fig. 1.
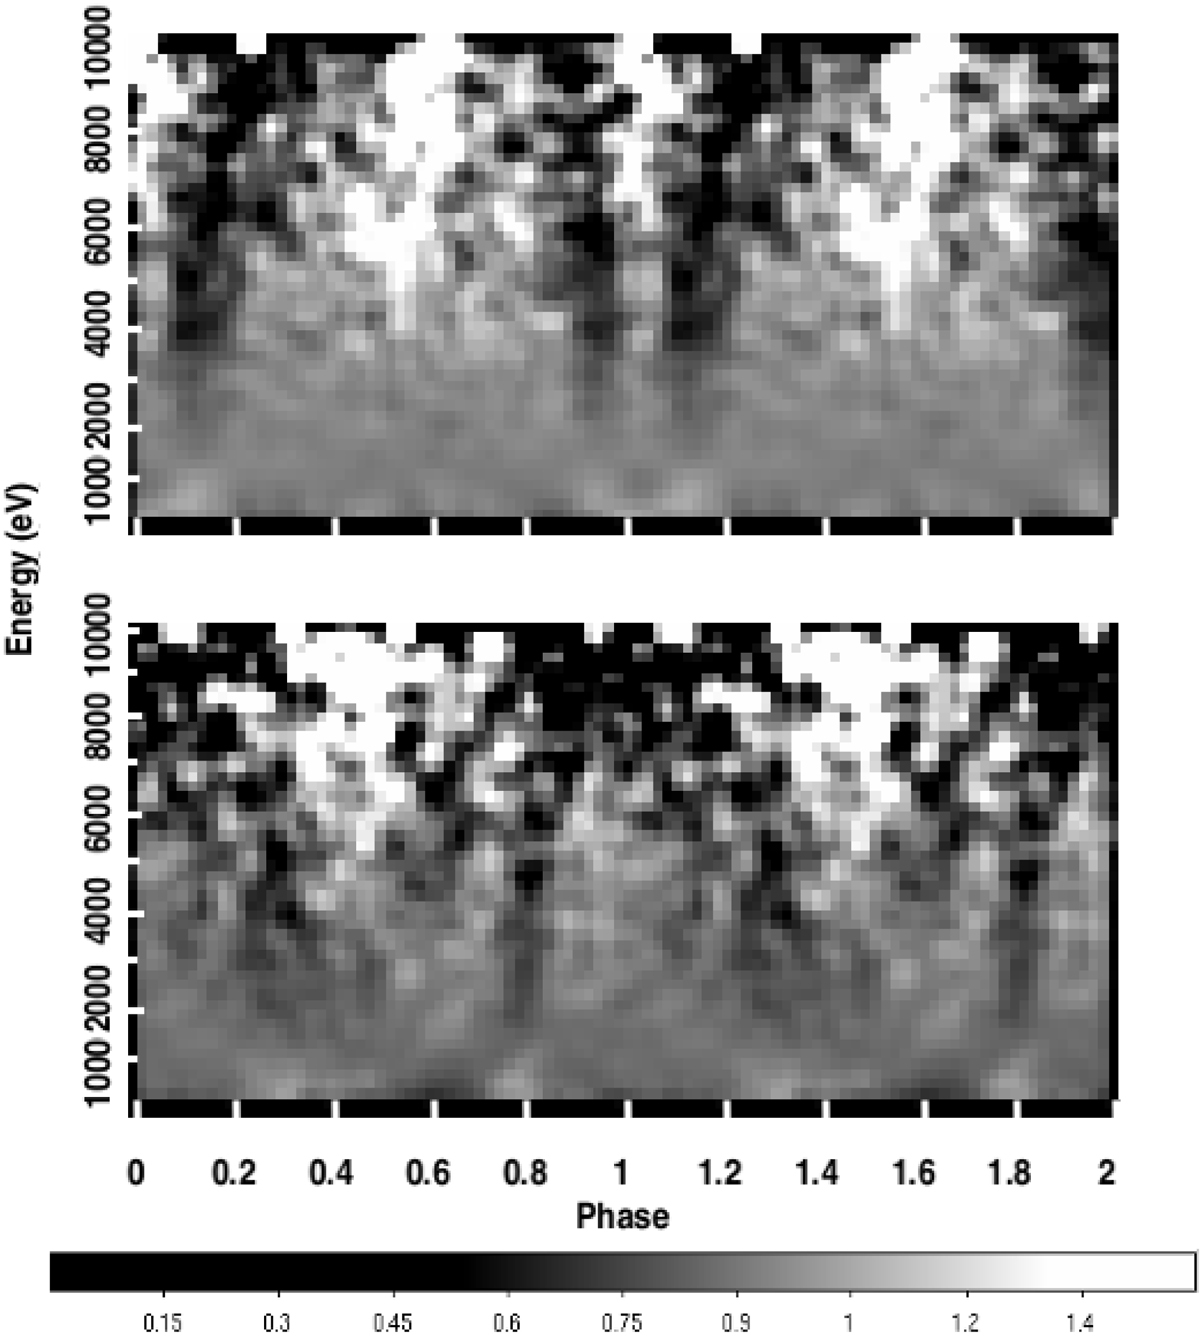
Top: phase-energy diagram for the EPIC PN data of observation A, obtained by binning the source counts into energy and rotational phase channels, then normalizing to the phase-averaged energy spectrum and energy-integrated pulse profile. Bottom: same for observation B, when the source was in outburst.
Current usage metrics show cumulative count of Article Views (full-text article views including HTML views, PDF and ePub downloads, according to the available data) and Abstracts Views on Vision4Press platform.
Data correspond to usage on the plateform after 2015. The current usage metrics is available 48-96 hours after online publication and is updated daily on week days.
Initial download of the metrics may take a while.