Fig. 5.
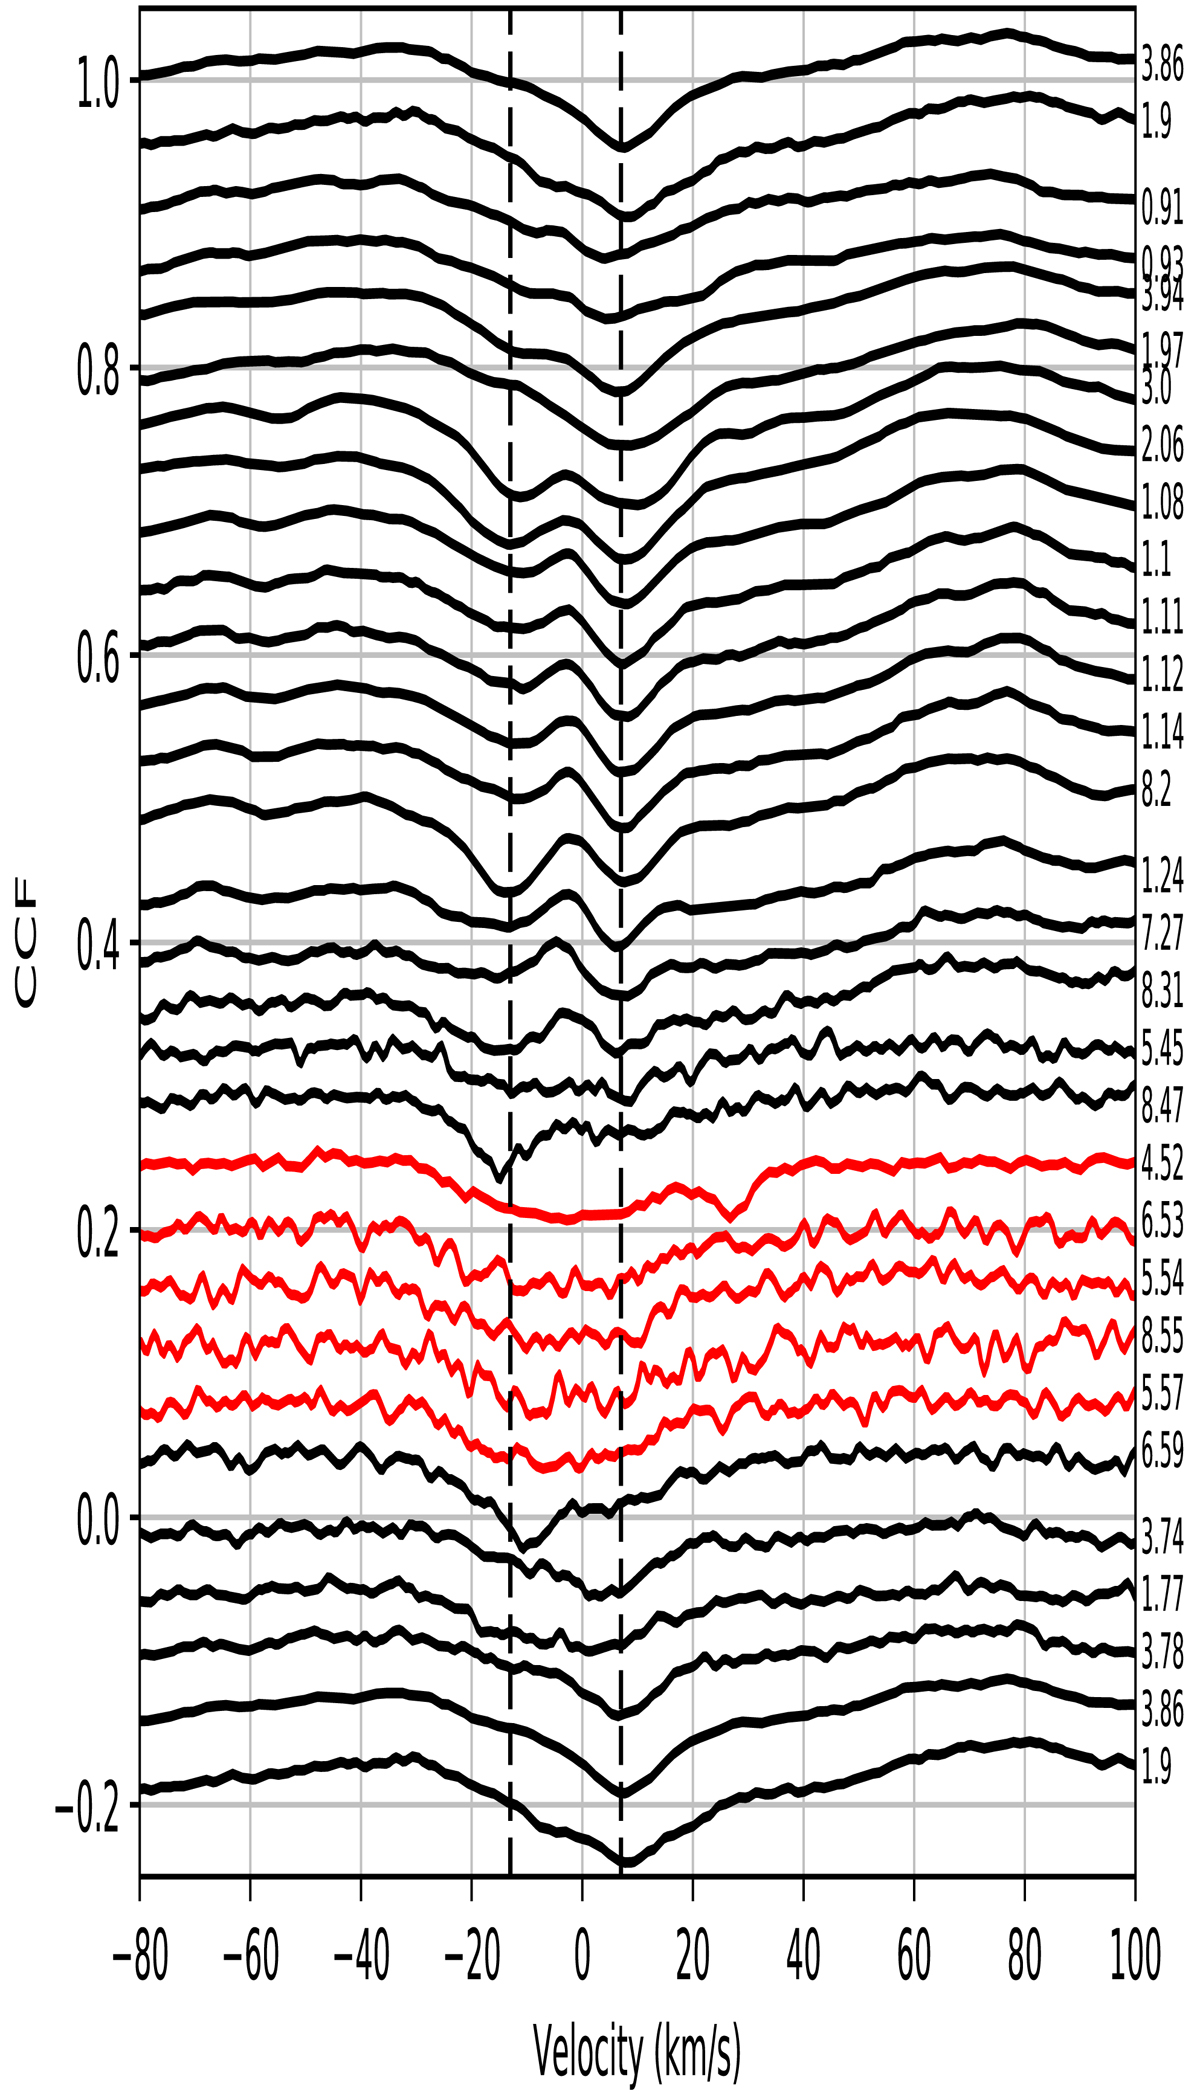
Cross-correlation functions of the S star T Sgr (using mask F0) ordered according to (fractional) photometric phase, counted in cycles (as labelled in the right margin) since the light maximum at JD 2454611 (see Fig. 4). The vertical dashed lines mark the two peaks appearing in the Mira spectrum between phases −0.1 and 0.3, at velocities −13 and +7 km s−1. These peaks exhibit no noticeable orbital drift over the 9 years covered by the radial-velocity monitoring. The noisy CCFs between phases 0.5 and 0.6 (represented in red, and corresponding to the Mira minimum light) reveal a broad single peak, most likely belonging to the F companion, centered around −2 km s−1, and with a rotational broadening of about 25 km s−1.
Current usage metrics show cumulative count of Article Views (full-text article views including HTML views, PDF and ePub downloads, according to the available data) and Abstracts Views on Vision4Press platform.
Data correspond to usage on the plateform after 2015. The current usage metrics is available 48-96 hours after online publication and is updated daily on week days.
Initial download of the metrics may take a while.