Fig. 4.
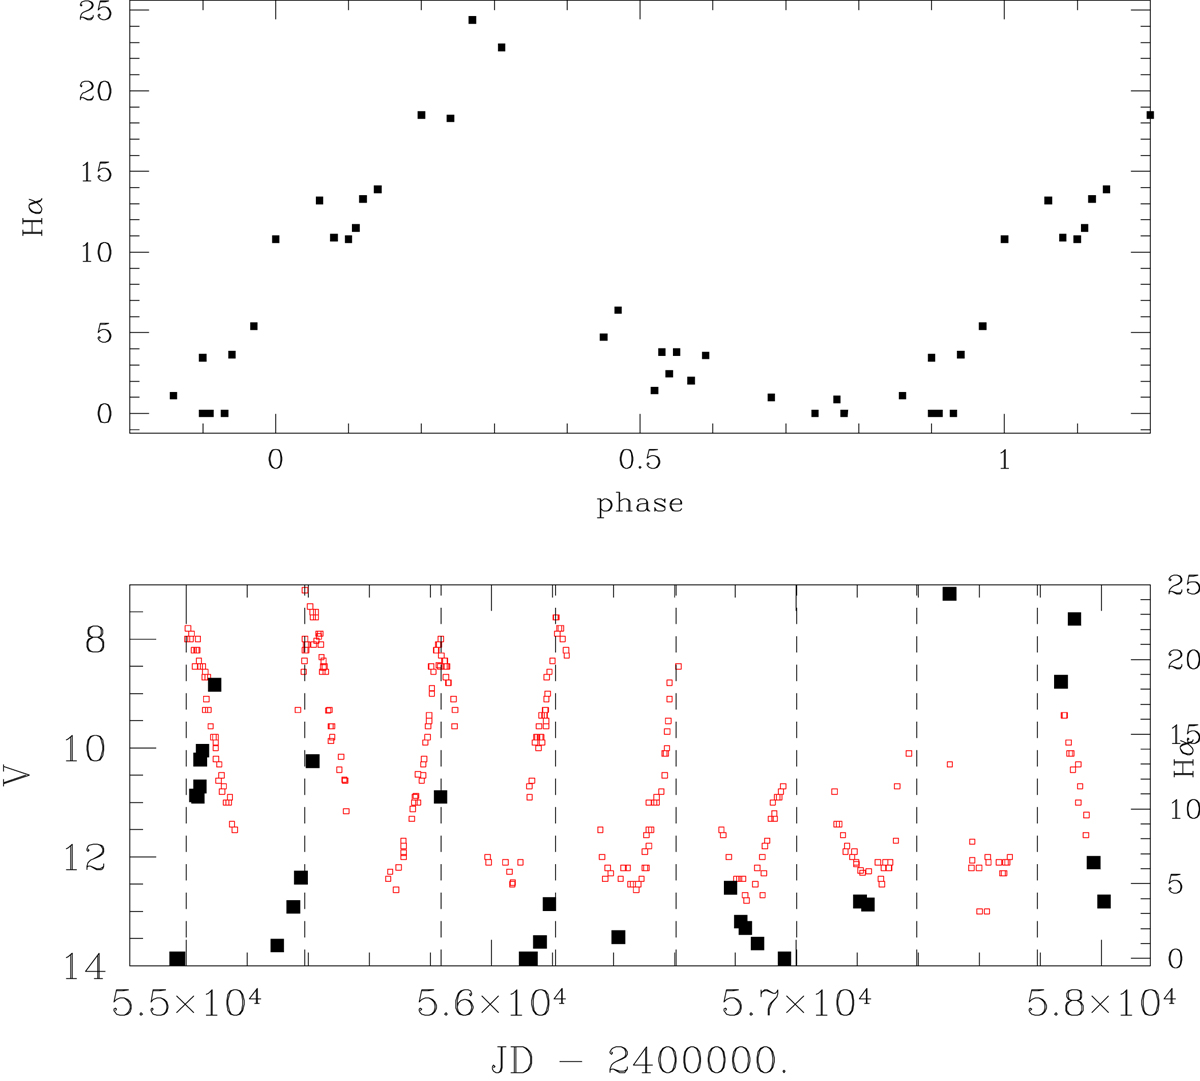
Bottom panel: light curve for the S star T Sgr (small red open squares), from the Association of French Variable Star Observers (AFOEV). The vertical dashed lines mark the light maxima, either directly identified on the light curve (the first four) or inferred from the GCVS period 394.7 d. The strength of the Balmer Hα emission line (peak value normalised with respect to the continuum) is represented as solid open squares to be read off the right scale. Top panel: Balmer Hα line strength as a function of the photometric phase.
Current usage metrics show cumulative count of Article Views (full-text article views including HTML views, PDF and ePub downloads, according to the available data) and Abstracts Views on Vision4Press platform.
Data correspond to usage on the plateform after 2015. The current usage metrics is available 48-96 hours after online publication and is updated daily on week days.
Initial download of the metrics may take a while.