Fig. 11.
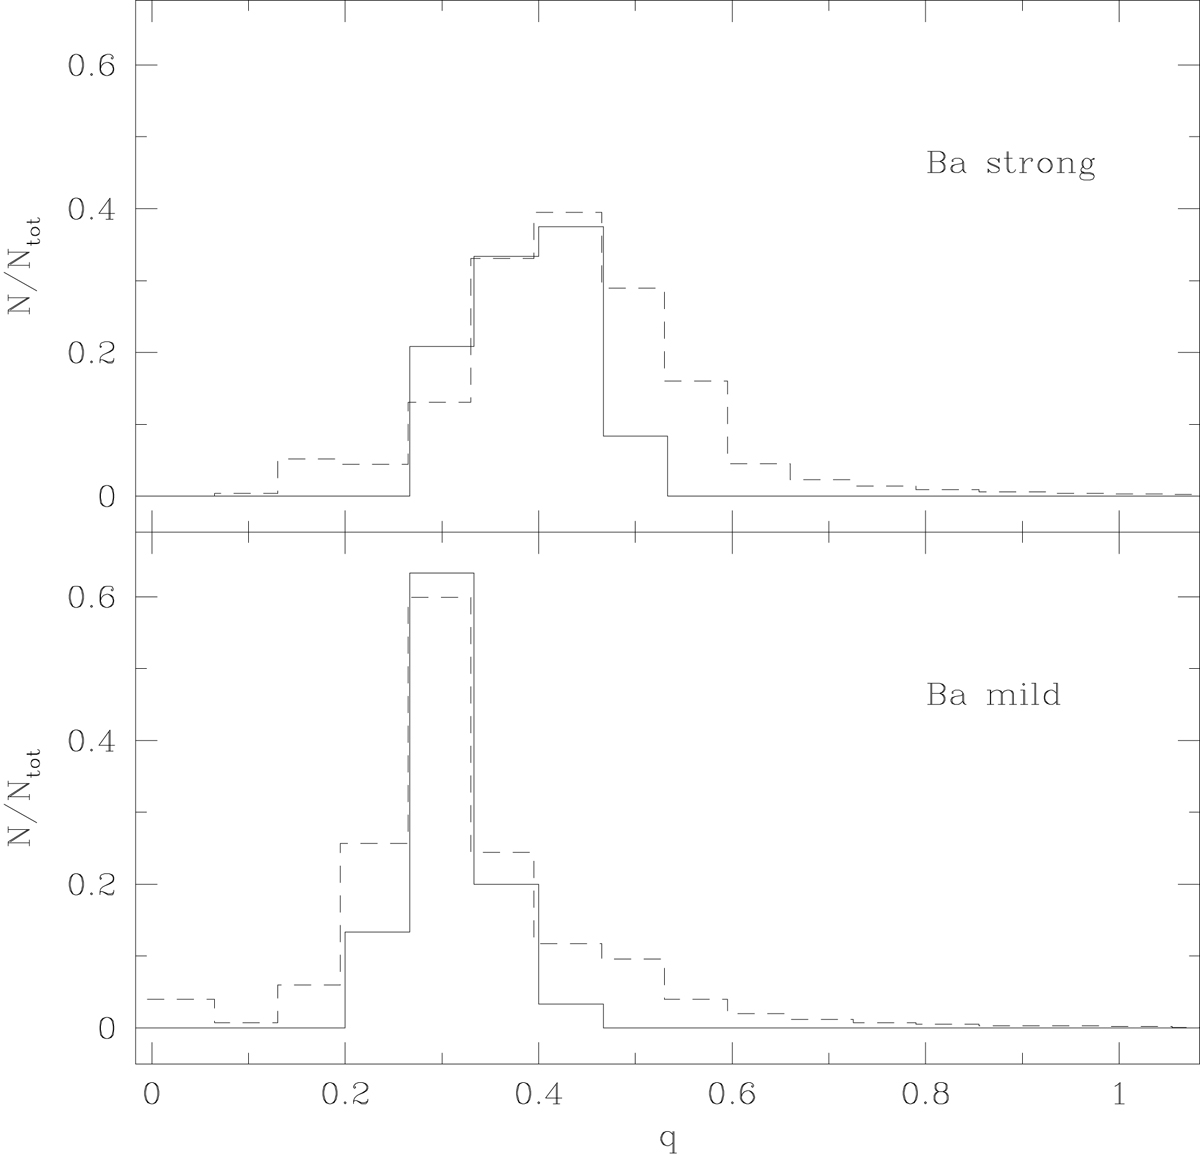
Mass-ratio distributions for mild (bottom panel) and strong (top panel) barium stars. The dashed lines correspond to the q distribution obtained from the Richardson-Lucy inversion (see text), whereas the solid line corresponds to the q distribution rederived from the individual MBa and MWD estimates (Table 8) under the assumption of a constant Q (different for mild and strong barium stars).
Current usage metrics show cumulative count of Article Views (full-text article views including HTML views, PDF and ePub downloads, according to the available data) and Abstracts Views on Vision4Press platform.
Data correspond to usage on the plateform after 2015. The current usage metrics is available 48-96 hours after online publication and is updated daily on week days.
Initial download of the metrics may take a while.