Fig. 1.
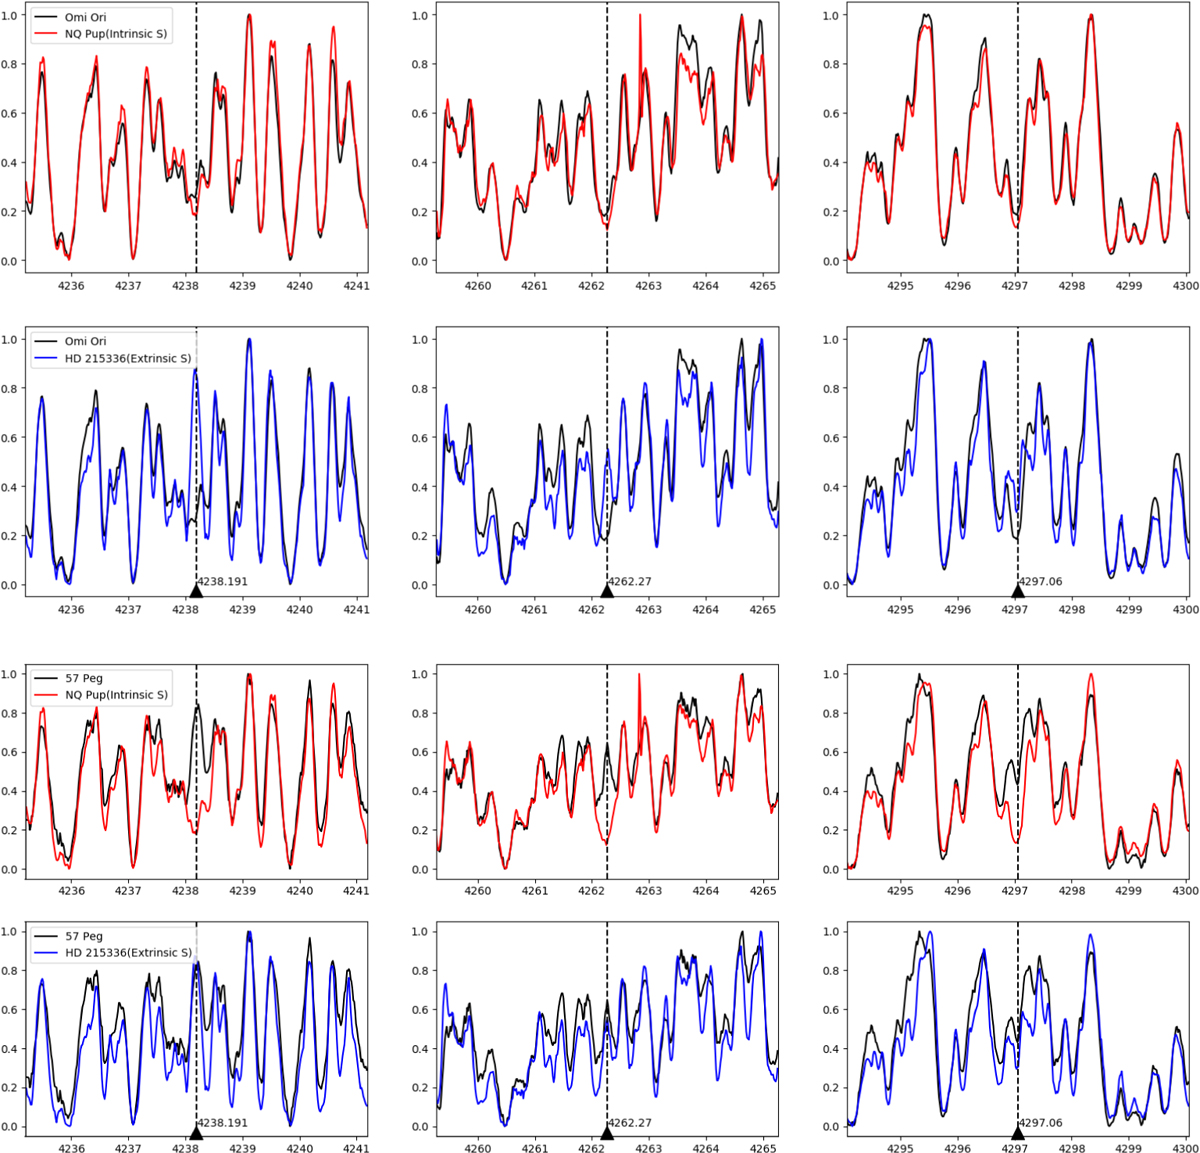
Spectral regions around the Tc I λ423.82 nm (left column), 426.23 (middle column), and 429.71 lines (right column). The star o1 Ori (black line) is compared to an intrinsic S star (NQ Pup; red line, first row) and to an extrinsic S star (HD 215336; blue line, second row), from HERMES spectra. Third and fourth rows: As in first and second rows, but for 57 Peg compared to the same intrinsic and extrinsic S stars.
Current usage metrics show cumulative count of Article Views (full-text article views including HTML views, PDF and ePub downloads, according to the available data) and Abstracts Views on Vision4Press platform.
Data correspond to usage on the plateform after 2015. The current usage metrics is available 48-96 hours after online publication and is updated daily on week days.
Initial download of the metrics may take a while.