Fig. 9.
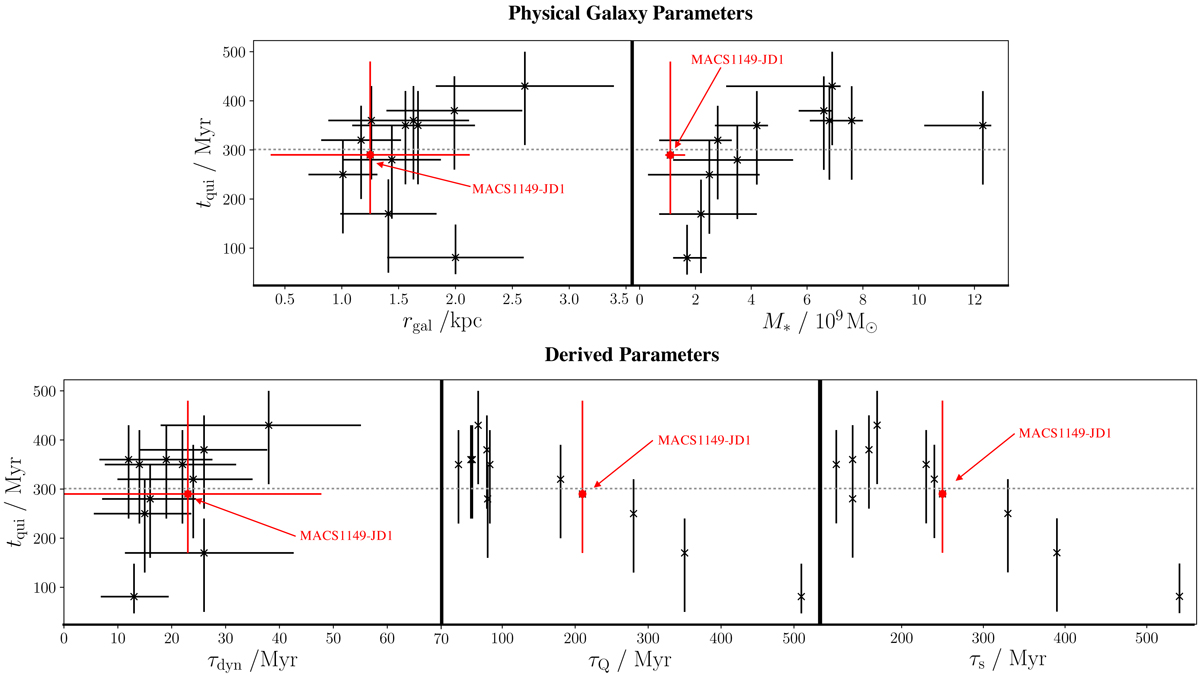
Quiescence timescales against generic physical (upper row) and derived (lower row) galactic parameters. The data of MACS1149-JD1 are highlighted in red (this galaxy is at much higher redshift than the others in the sample, but does not otherwise appear to be unusual). The value of tqui averaged over all data points is indicated by the horizontal dashed grey line. Upper left: plot against estimated galaxy radius. This indicates that the quiescent time scale is also independent of the size of the system, with a weighted Pearson correlation coefficient of 0.15. Error bars in rgal are as quoted in the literature (A1689-zD1 at 50% and MACS1149-JD1 at 71%), otherwise estimated as 30%. Upper right: plot against stellar mass, which shows a positive correlation (coefficient of 0.58). Lower left: plot against galaxy dynamical timescales, which tqui appears to be independent of, with a correlation of 0.06. Lower centre: plot against quenching timescale, τQ, which shows a negative correlation (coefficient of −0.81). This is consistent with tqui being a marker for the strength of feedback – the longer taken to quench star-formation, the weaker the CR driven feedback and the shorter the quiescence timescale. Uncertainties in τQ are unclear and so are not plotted. Lower right: as per the centre panel, but against the strangulation timescale, τS. Again the negative correlation (of coefficient −0.78) is consistent with tqui being influenced by feedback with shorter values for longer strangulation times. As with τQ, uncertainties in τS are not clear so are omitted.
Current usage metrics show cumulative count of Article Views (full-text article views including HTML views, PDF and ePub downloads, according to the available data) and Abstracts Views on Vision4Press platform.
Data correspond to usage on the plateform after 2015. The current usage metrics is available 48-96 hours after online publication and is updated daily on week days.
Initial download of the metrics may take a while.