Fig. 4.
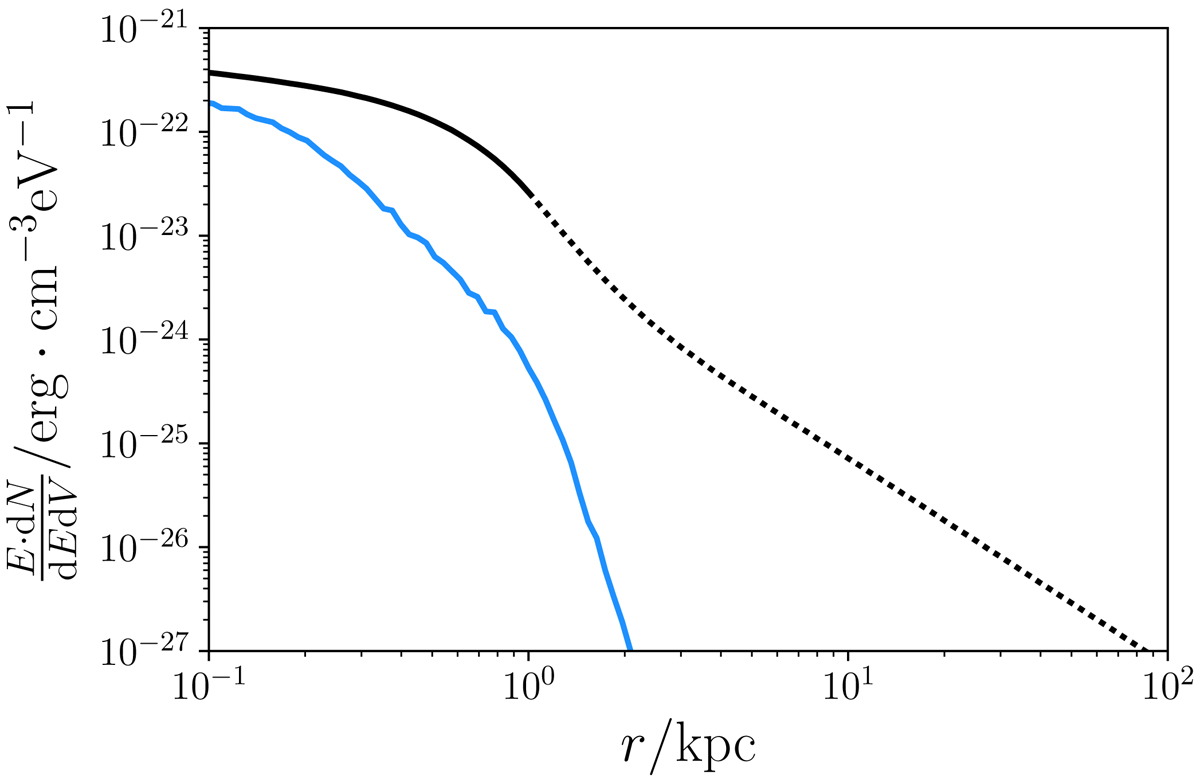
Steady-state protogalactic CR proton (primary) and electron (secondary) profile integrated over all energies for a SN rate ℛSN = 0.1 yr−1. The blue line shows the profile for electrons, while the black line corresponds to protons. The solid part of the black line is the proton distribution within the interstellar medium of the protogalaxy, where the magnetic field model is more robust. Outside the protogalaxy, the magnetic field is less well understood and so our result (the dashed part of the black line) should be regarded as an upper limit.10
Current usage metrics show cumulative count of Article Views (full-text article views including HTML views, PDF and ePub downloads, according to the available data) and Abstracts Views on Vision4Press platform.
Data correspond to usage on the plateform after 2015. The current usage metrics is available 48-96 hours after online publication and is updated daily on week days.
Initial download of the metrics may take a while.