Fig. 3.
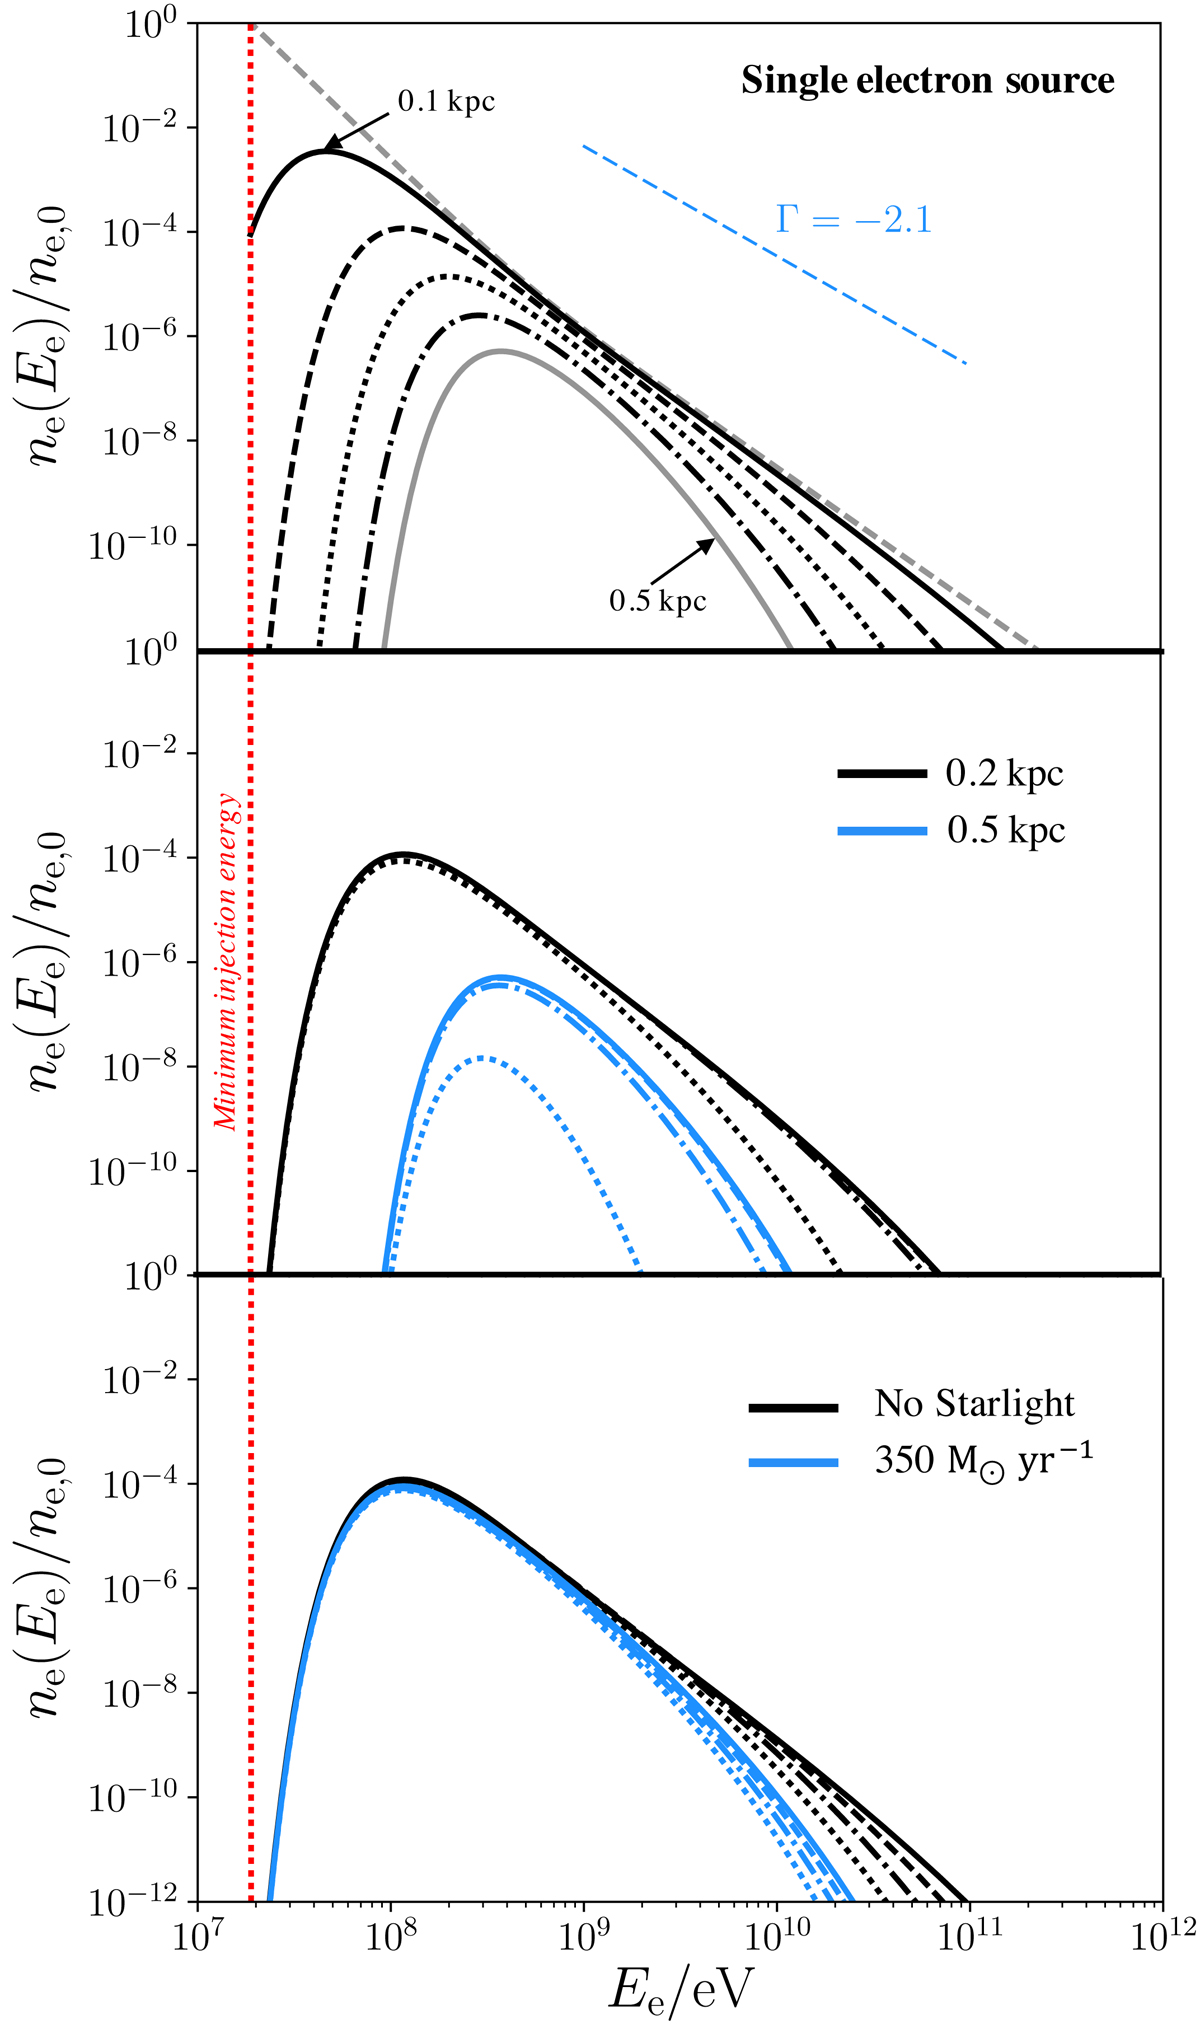
Electron spectra following their injection from a single discrete source (normalised to the injection level at the minimum energy indicated by the dashed red line, ne, 0), accounting for variations in the energy densities of the radiation fields governing inverse-Compton cooling as well as electron diffusion. In all panels, the minimum energy at which CR secondary electrons may be injected is indicated by the dashed red vertical line – this would correspond to the secondaries produced when a 0.28 GeV CR proton primary undergoes a pp interaction. The injection spectral index would be approximately Γ = −2.1, as indicated in blue in the upper panel. Indices of subsequent steady-state spectra are steeper than this due to the energy dependence of the electron cooling rate. Upper panel: spectral variation with distance: dashed light grey line shows the steady-state spectrum expected at the injection point (we note that this is not the injection spectrum); remaining lines (solid black through to solid grey) denote the spectrum at 0.1–0.5 kpc in 0.1 kpc increments when adopting a CMB energy density at z = 7 and no stellar radiation field. The steepening of the high-end of the spectrum with distance is due to the energy-dependence of the radiative cooling function and of electron diffusion (with higher energy particles diffusing and undergoing radiative cooling more quickly). Middle panel: as above, but spectra calculated at 0.2 kpc (black lines) and 0.5 kpc (blue lines) from their injection location, with CMB at z = 7 and the spectral lines indicating evolution according to: no stellar radiation field (solid lines), stellar radiation field consistent with ℛSF = 3.5 M⊙ yr−1 (dashed lines), ℛSF = 35 M⊙ yr−1 (dot-dashed lines) and ℛSF = 350 M⊙ yr−1 (dotted lines) where star-formation is concentrated in a 1 kpc volume. Lower panel: as above, but with all lines calculated at 0.2 kpc from their injection source location, lines in black corresponding to a CMB-only radiation field and lines in blue corresponding to a strong radiation field with ℛSF = 350 M⊙ yr−1, shown at different redshifts over a similar range to our high-redshift galaxy sample: z = 6 (solid line), 7 (dashed line), 8 (dot-dashed line) and 9 (dotted line).
Current usage metrics show cumulative count of Article Views (full-text article views including HTML views, PDF and ePub downloads, according to the available data) and Abstracts Views on Vision4Press platform.
Data correspond to usage on the plateform after 2015. The current usage metrics is available 48-96 hours after online publication and is updated daily on week days.
Initial download of the metrics may take a while.