Fig. D.2.
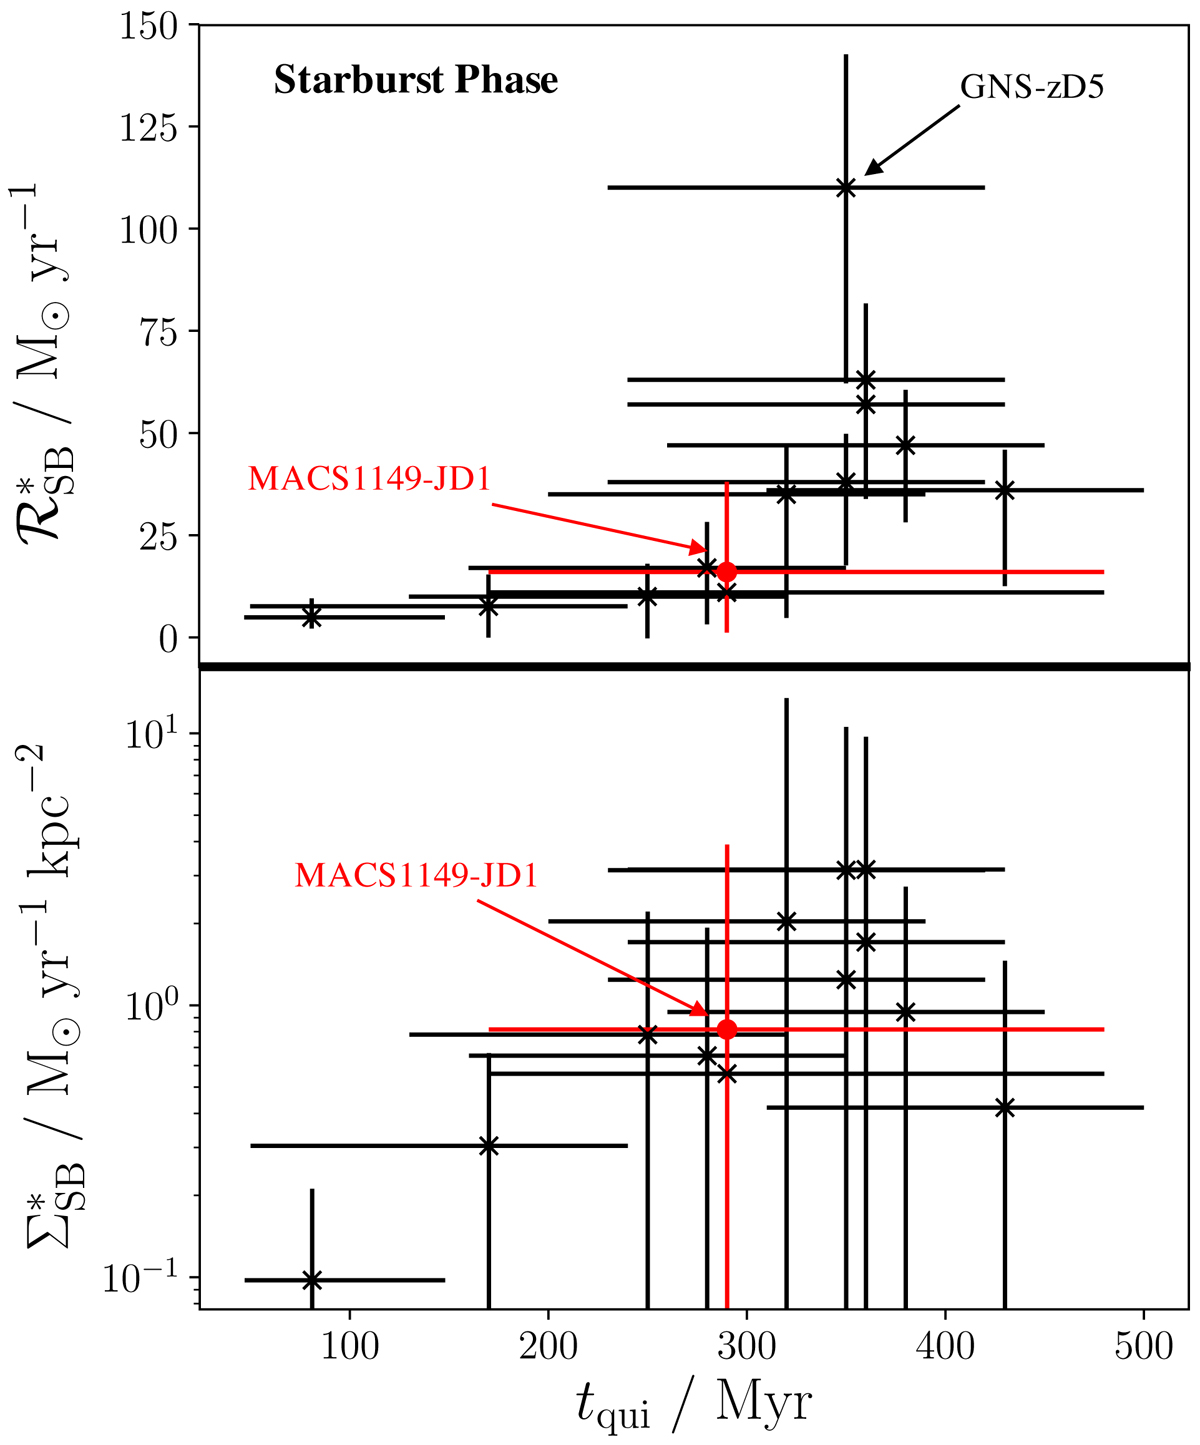
As Fig. D.1, but for the starburst phase of each system. The weighted Pearson correlation value for the top panel is found to be 0.71, while the lower panel indicates two behaviours with a less clear trend (overall correlation of 0.39) – see text for details. As SSFR is estimated in the burst phase using tSB and M* rather than being determined independently, it is not physically meaningful to include it here.
Current usage metrics show cumulative count of Article Views (full-text article views including HTML views, PDF and ePub downloads, according to the available data) and Abstracts Views on Vision4Press platform.
Data correspond to usage on the plateform after 2015. The current usage metrics is available 48-96 hours after online publication and is updated daily on week days.
Initial download of the metrics may take a while.