Fig. D.1.
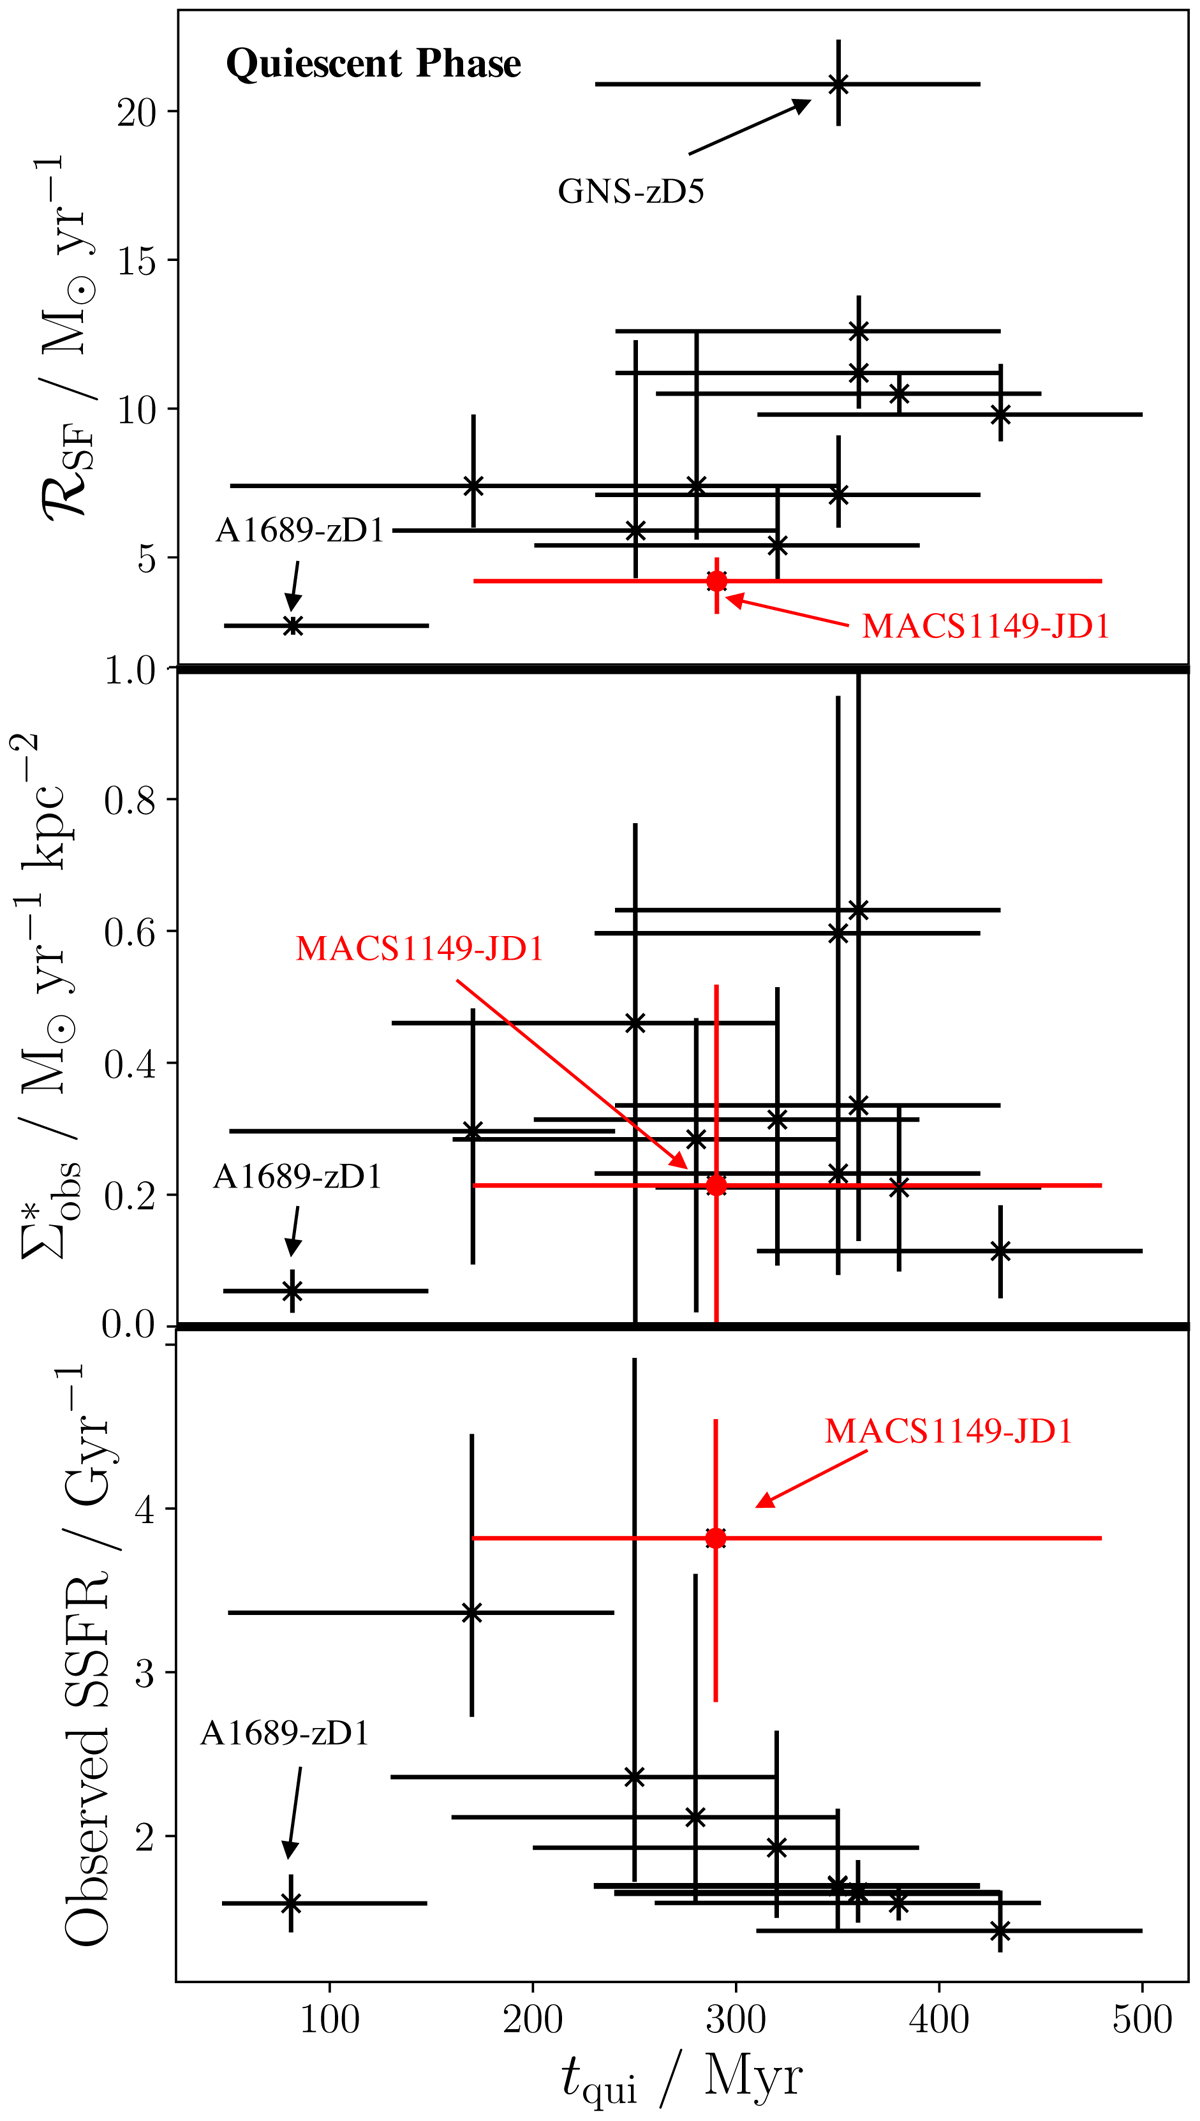
Star-formation rates in the sample of 12 post-starburst galaxies. MACS1149-JD1 is highlighted in red in all panels as this galaxy is at substantially higher redshift (z = 9.11) than the others in the sample. Upper panel: observed quiescent star-formation rate ℛSF plotted against the length of quiescence period. This period is measured up to the point of observation, so tqui effectively indicates the time elapsed since the end of starburst activity. This shows a strong positive correlation, with a Pearson coefficient (weighted by the error bounds) of 0.93. Middle panel: as above, except the y-axis is star-formation rate surface density (![]() ). This removes the correlation seen in the upper panel, with a Pearson coefficient of −0.02 (when removing the clear outlier A1689-zD1, as labelled). Lower panel: y-axis as specific star-formation rate, which is adjusted for galaxy mass where SSFR = ℛSF/M*. If removing the labelled outlier A1689-zD1, this now gives a non-negligible negative correlation of weighted Pearson coefficient −0.64.
). This removes the correlation seen in the upper panel, with a Pearson coefficient of −0.02 (when removing the clear outlier A1689-zD1, as labelled). Lower panel: y-axis as specific star-formation rate, which is adjusted for galaxy mass where SSFR = ℛSF/M*. If removing the labelled outlier A1689-zD1, this now gives a non-negligible negative correlation of weighted Pearson coefficient −0.64.
Current usage metrics show cumulative count of Article Views (full-text article views including HTML views, PDF and ePub downloads, according to the available data) and Abstracts Views on Vision4Press platform.
Data correspond to usage on the plateform after 2015. The current usage metrics is available 48-96 hours after online publication and is updated daily on week days.
Initial download of the metrics may take a while.