Fig. B.1.
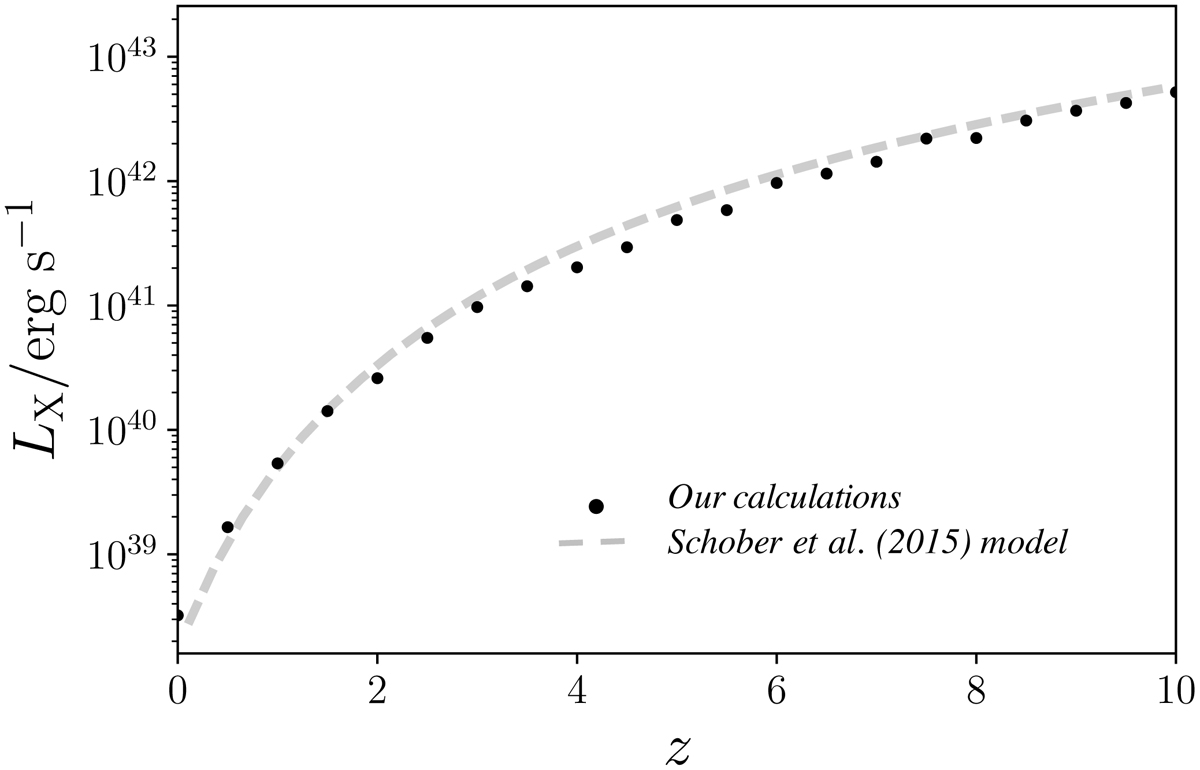
Inverse-Compton protogalaxy X-ray luminosity evolution over redshift, as calculated using the approach detailed in this paper with ℛSN ≈ 1 yr−1 (semi-analytical Monte-Carlo simulation) compared to the earlier study, Schober et al. (2015) (dashed grey line), which adopts an analytical model. Our results are consistent with those obtained by Schober et al. (2015).
Current usage metrics show cumulative count of Article Views (full-text article views including HTML views, PDF and ePub downloads, according to the available data) and Abstracts Views on Vision4Press platform.
Data correspond to usage on the plateform after 2015. The current usage metrics is available 48-96 hours after online publication and is updated daily on week days.
Initial download of the metrics may take a while.