Free Access
Fig. 11.
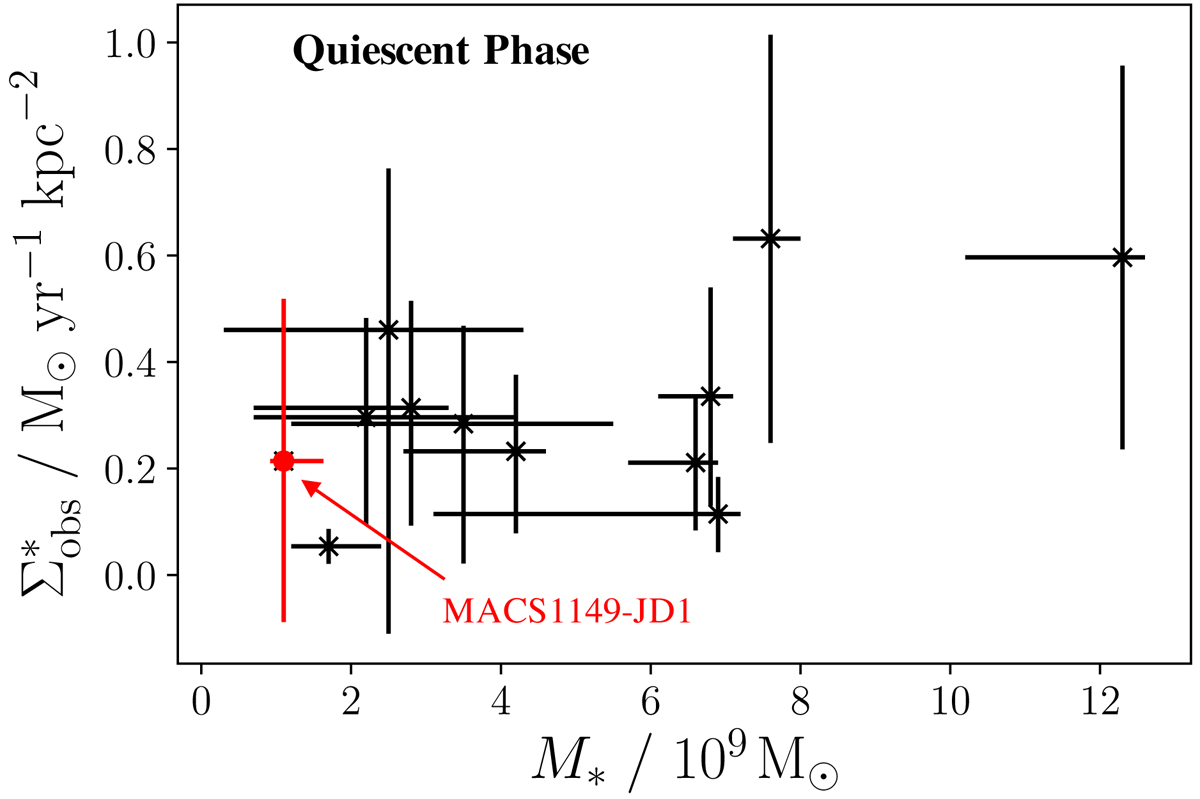
Observed star-formation rate surface densities for the post-starburst sample plotted against stellar mass. This shows a moderate correlation (weighted Pearson coefficient of 0.55). Again, the high redshift system MACS1149-JD1 is highlighted in red, but does not appear to be inconsistent with the rest of the sample.
Current usage metrics show cumulative count of Article Views (full-text article views including HTML views, PDF and ePub downloads, according to the available data) and Abstracts Views on Vision4Press platform.
Data correspond to usage on the plateform after 2015. The current usage metrics is available 48-96 hours after online publication and is updated daily on week days.
Initial download of the metrics may take a while.