Fig. 10.
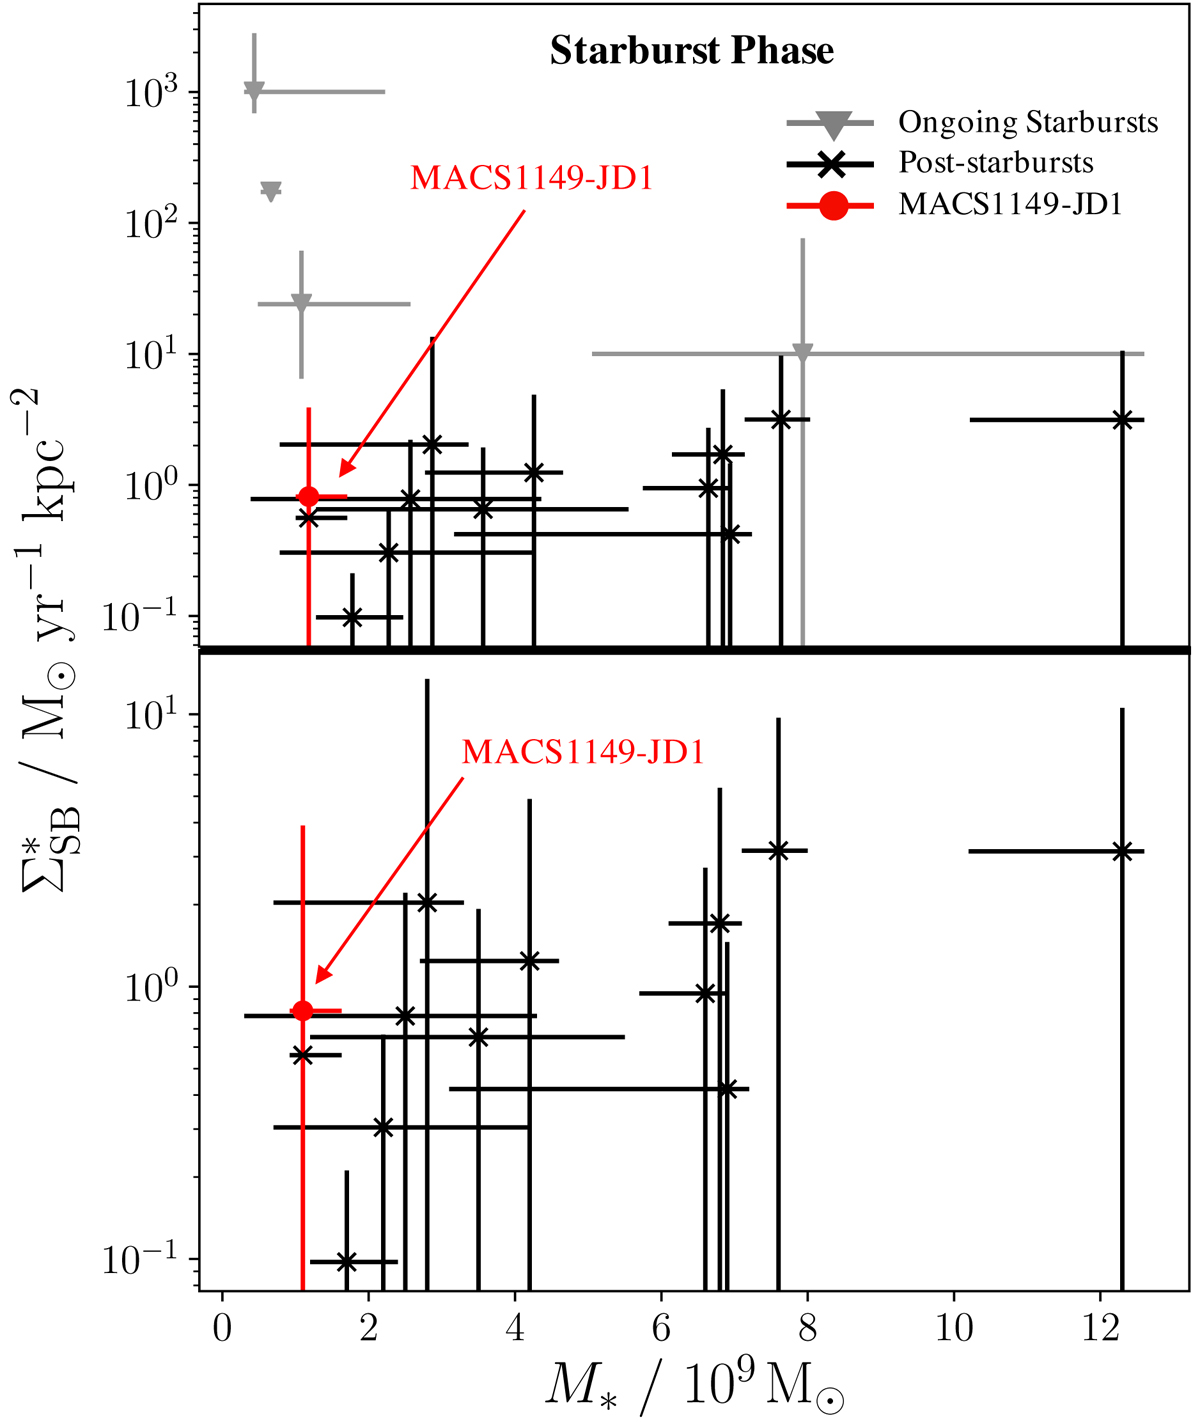
Star-formation rate surface density plotted against galaxy stellar mass, indicating these quantities are moderately correlated (weighted Pearson coefficient of 0.71 for the post-starburst systems). Upper panel: ![]() for the four galaxies observed during their starburst phase (see Table 2) are plotted in grey, with the post-starbursts are shown in black (see Table 1). We plot the MACS1149-JD1 in red (this system is observed at a much higher redshift than the others in the sample, but its behaviour appears to be relatively consistent). Lower panel: as above, with the removal of the starbursts to more clearly show the distribution of the post-starburst galaxies.
for the four galaxies observed during their starburst phase (see Table 2) are plotted in grey, with the post-starbursts are shown in black (see Table 1). We plot the MACS1149-JD1 in red (this system is observed at a much higher redshift than the others in the sample, but its behaviour appears to be relatively consistent). Lower panel: as above, with the removal of the starbursts to more clearly show the distribution of the post-starburst galaxies.
Current usage metrics show cumulative count of Article Views (full-text article views including HTML views, PDF and ePub downloads, according to the available data) and Abstracts Views on Vision4Press platform.
Data correspond to usage on the plateform after 2015. The current usage metrics is available 48-96 hours after online publication and is updated daily on week days.
Initial download of the metrics may take a while.