Fig. 8.
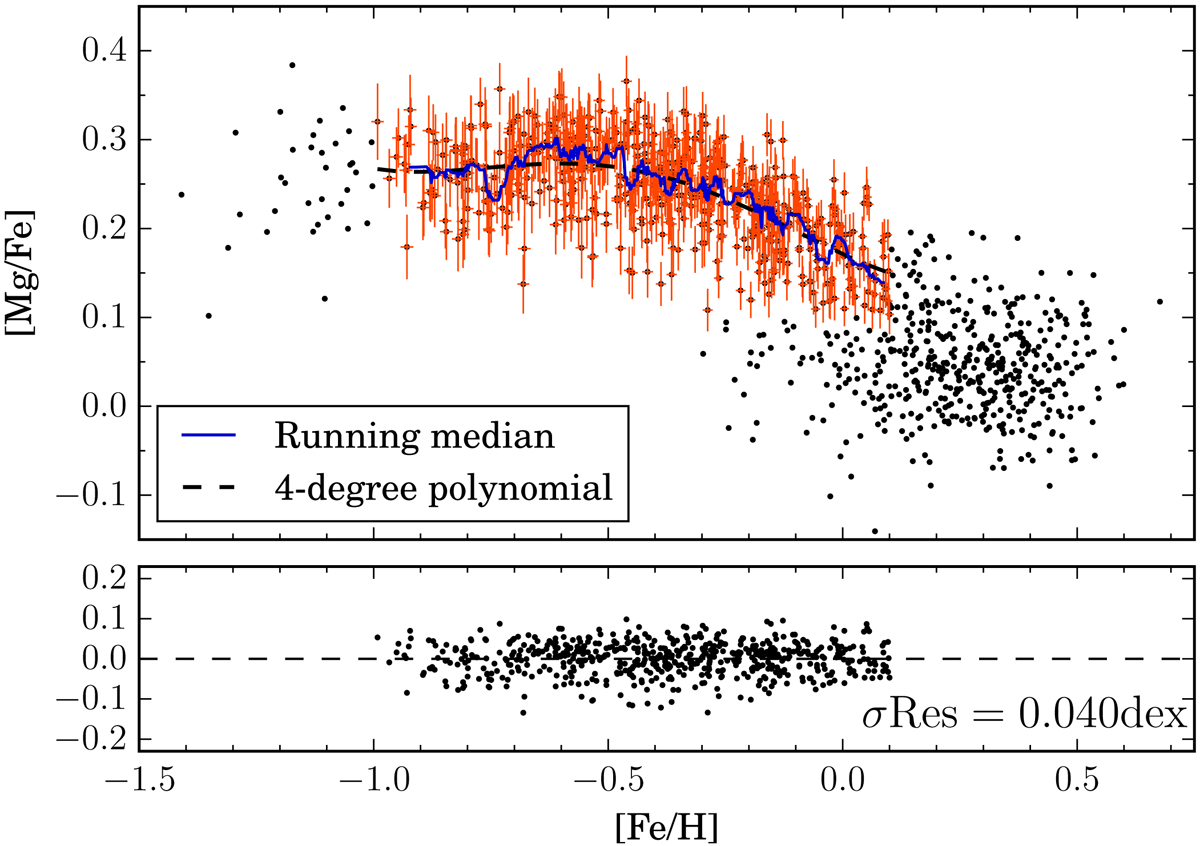
Estimation of the [Mg/Fe] dispersion of the metal-poor bulge sequence in the [Mg/Fe] versus [Fe/H] plane. Upper panel: black points stand for the whole close-to-the-plane bulge sample. The stars of the Mg-rich sequence with [Fe/H] > −1.0 dex are highlighted in red, with error bars accounting for their individual abundance measurement errors. A running median for these stars is displayed as a blue solid line. A fourth-degree polynomial model fit on the data is displayed by the black dashed line. Lower panel: residuals distribution from the polynomial fit. The dashed black line depicts the zero bias level. The standard deviation of the residuals is quoted in the panel.
Current usage metrics show cumulative count of Article Views (full-text article views including HTML views, PDF and ePub downloads, according to the available data) and Abstracts Views on Vision4Press platform.
Data correspond to usage on the plateform after 2015. The current usage metrics is available 48-96 hours after online publication and is updated daily on week days.
Initial download of the metrics may take a while.