Fig. 6.
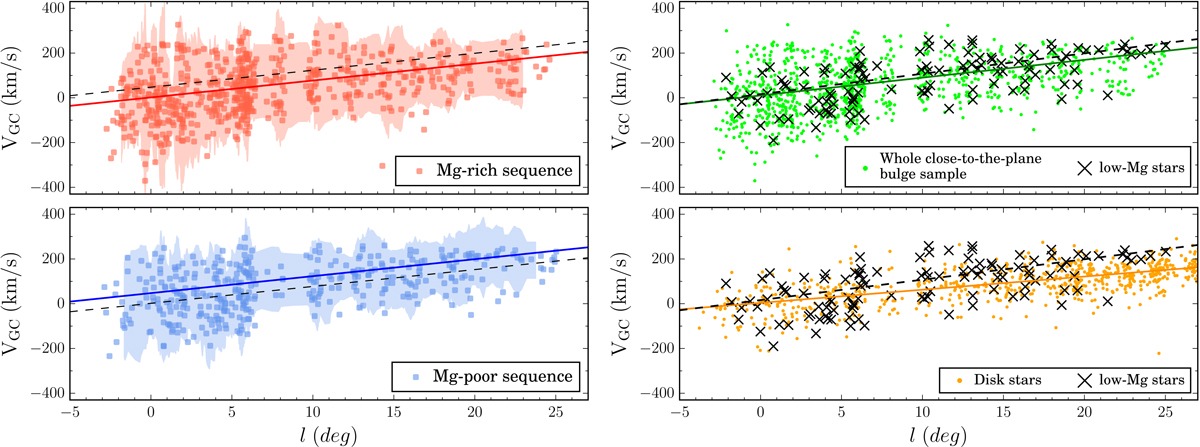
Galactocentric velocity versus longitude. Left panels: individual stars of the Mg- rich/poor sequences (as defined in the main text) are displayed with red/blue color in the upper/lower panel. In each case, the mean linear trend of the data is displayed as a solid colored line (estimated with the Theil–Sen estimator for robustness), and the 2σ dispersion band as a shaded area. For visual aid, in each panel the linear trend of the other distribution is displayed as a dashed black line. Right upper panel: whole close-to-the-plane sample (thus the union of all stars displayed in the left panels) is displayed as green points with its linear trend as a solid line of the same color. Black crosses depict the subsample of low-Mg stars (in the metallicity range where Mg-bimodality is seen; see main text), with its linear trend displayed as a dashed black line. Right lower panel: sample of disk stars, selected as 3.5 < RGC < 5.0 kpc and |Z| < 0.5 kpc, displayed as orange points, with its linear fit as a solid orange line. Black crosses and the dashed black line have the same meaning as in the upper panel.
Current usage metrics show cumulative count of Article Views (full-text article views including HTML views, PDF and ePub downloads, according to the available data) and Abstracts Views on Vision4Press platform.
Data correspond to usage on the plateform after 2015. The current usage metrics is available 48-96 hours after online publication and is updated daily on week days.
Initial download of the metrics may take a while.