Fig. 5.
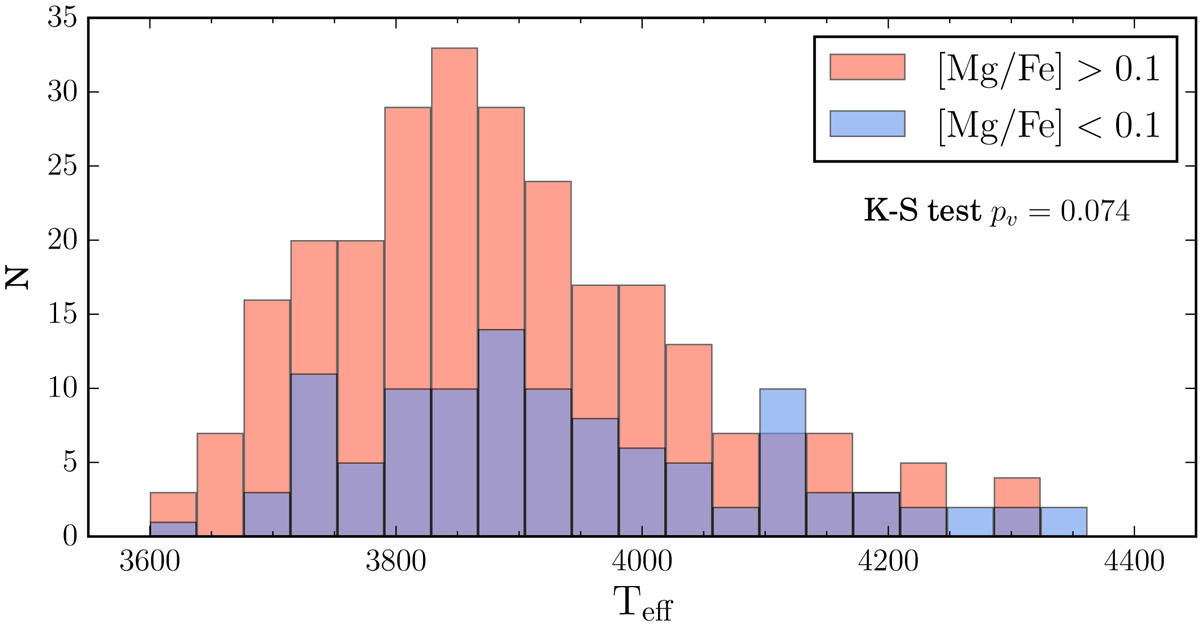
Teff distribution for stars located in the metallicity region highlighted in Fig. 4, where the parallel sequences are observed. The red/blue histogram shows stars belonging to the high-/low-magnesium sequence. The p-value of a two-sample Kolmogorov–Smirnov applied on the date is quoted in the figure. From its value we cannot reject the null hypothesis that both distributions are drawn from the same parent population.
Current usage metrics show cumulative count of Article Views (full-text article views including HTML views, PDF and ePub downloads, according to the available data) and Abstracts Views on Vision4Press platform.
Data correspond to usage on the plateform after 2015. The current usage metrics is available 48-96 hours after online publication and is updated daily on week days.
Initial download of the metrics may take a while.