Fig. 4.
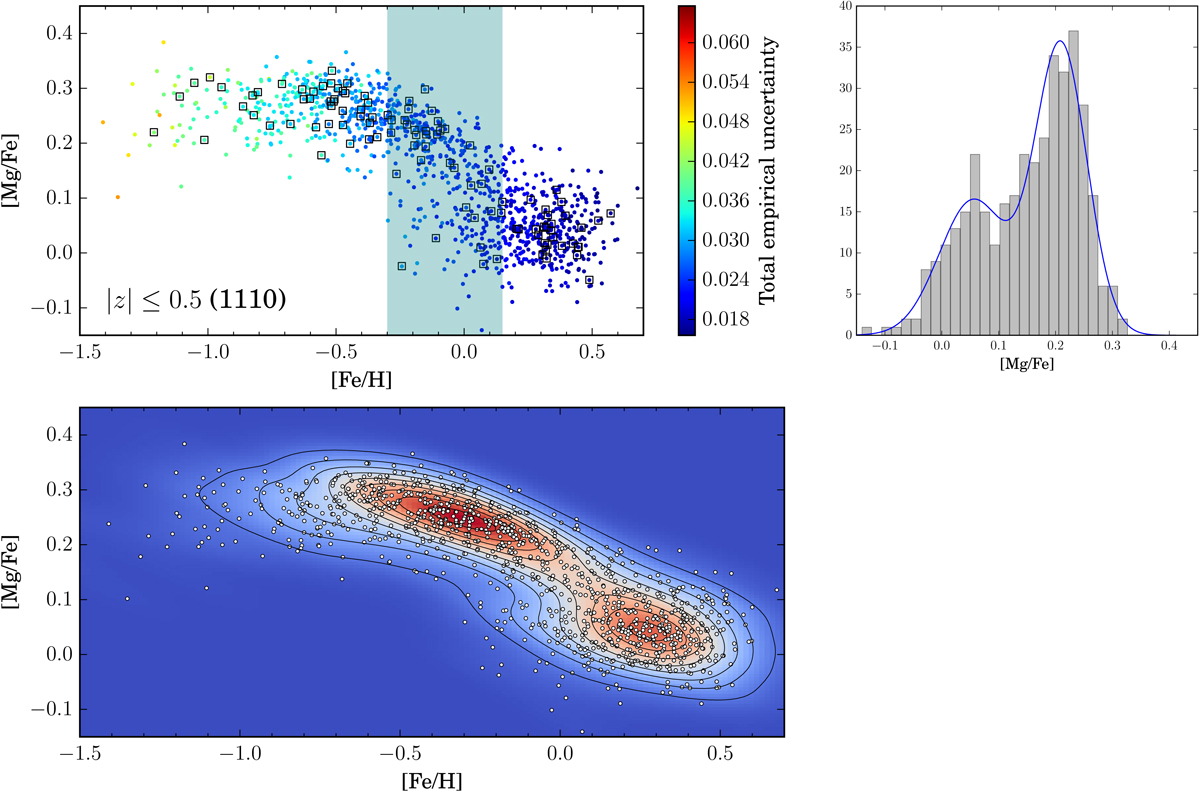
Upper panels: distribution of close-to-the-plane bulge stars (RGC ≤ 3.5 kpc, |z| ≤ 0.5 kpc) in the [Mg/Fe] versus [Fe/H] plane. Points are color coded according to their total empirical uncertainty defined as the sum in quadrature of the respective abundance measurement errors. Black squares highlight a subsample of stars for which relatively good-quality distance estimations (also indicating RGC ≤ 3.5 kpc) are available from the Gaia DR2 Bayesian distance catalog of Bailer-Jones et al. (2018). A shaded vertical area highlights the metallicity range (−0.3 ≤ [Fe/H] ≤ 0.15 dex) in which stars are selected to plot their [Mg/Fe] ratio histogram in the right panel. The best (bimodal) Gaussian mixture, as estimated from an analysis of Gaussian mixture models is displayed with a blue line. Lower panel: Gaussian kernel estimation of the data (open black points) displayed as a density colormap, with a set of density contours as black lines.
Current usage metrics show cumulative count of Article Views (full-text article views including HTML views, PDF and ePub downloads, according to the available data) and Abstracts Views on Vision4Press platform.
Data correspond to usage on the plateform after 2015. The current usage metrics is available 48-96 hours after online publication and is updated daily on week days.
Initial download of the metrics may take a while.