Fig. 3.
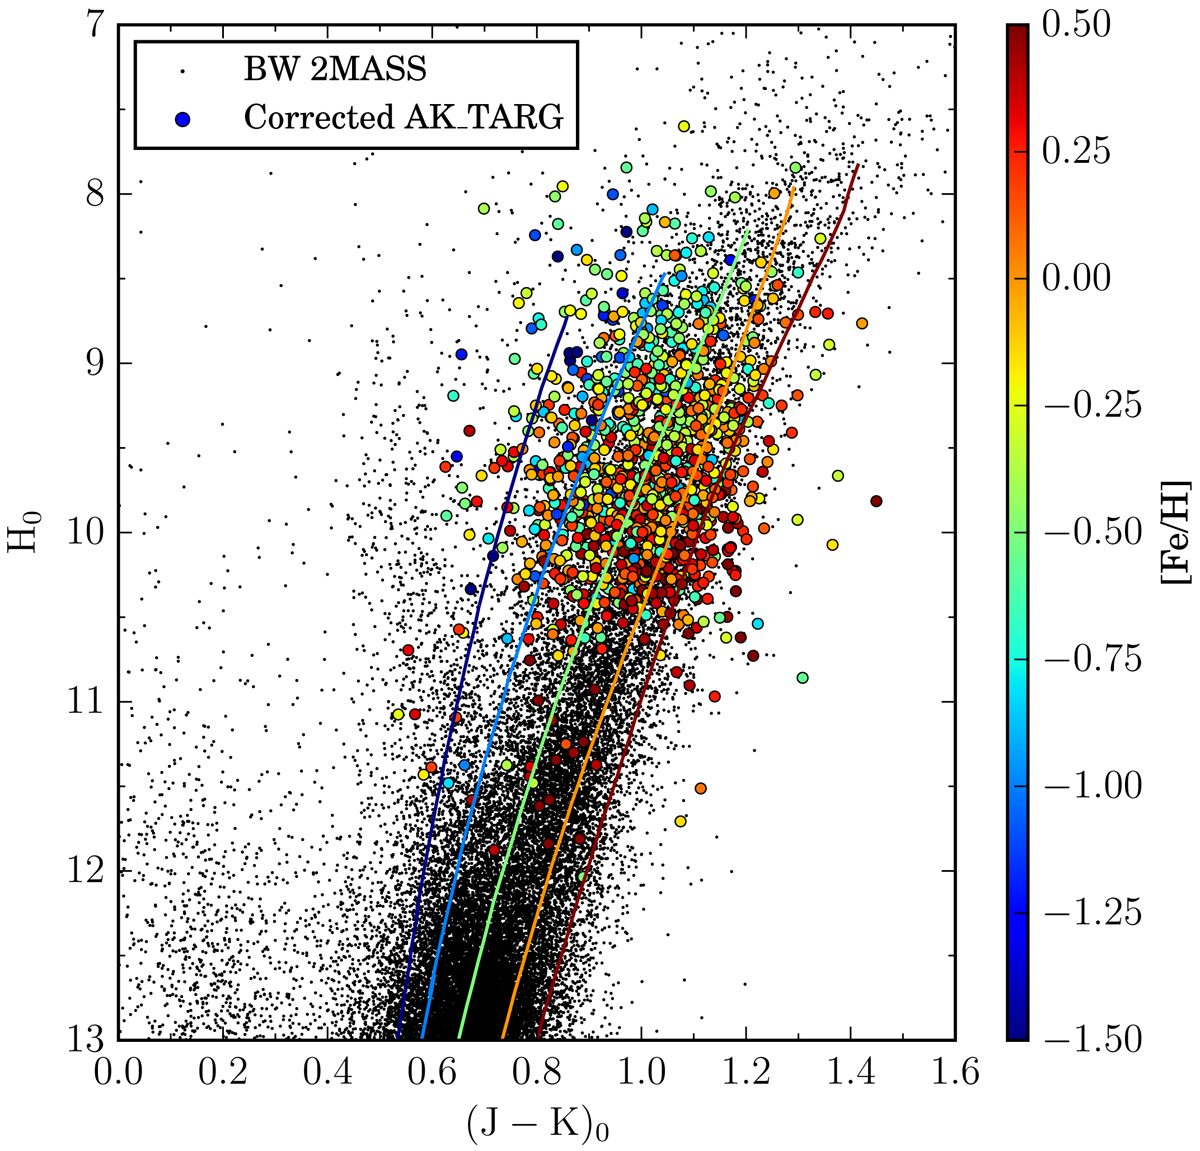
2MASS H0 versus (J − K)0 diagram. Black dots represent stars in Baade’s Window (as an example of a clean bulge-like CMD) dereddened using the extinction map Gonzalez et al. (2012) through the beam calculator (http://mill.astro.puc.cl/BEAM/calculator.php). Overlaid with circles and color coded according to their metallicity are the stars of the selected spectroscopic sample, dereddened by adopting the DR14 ancillary data for AK. A set of PARSEC isochrones of 10 Gyr is depicted by the solid lines, also color coded according to their metallicity.
Current usage metrics show cumulative count of Article Views (full-text article views including HTML views, PDF and ePub downloads, according to the available data) and Abstracts Views on Vision4Press platform.
Data correspond to usage on the plateform after 2015. The current usage metrics is available 48-96 hours after online publication and is updated daily on week days.
Initial download of the metrics may take a while.