Fig. 1.
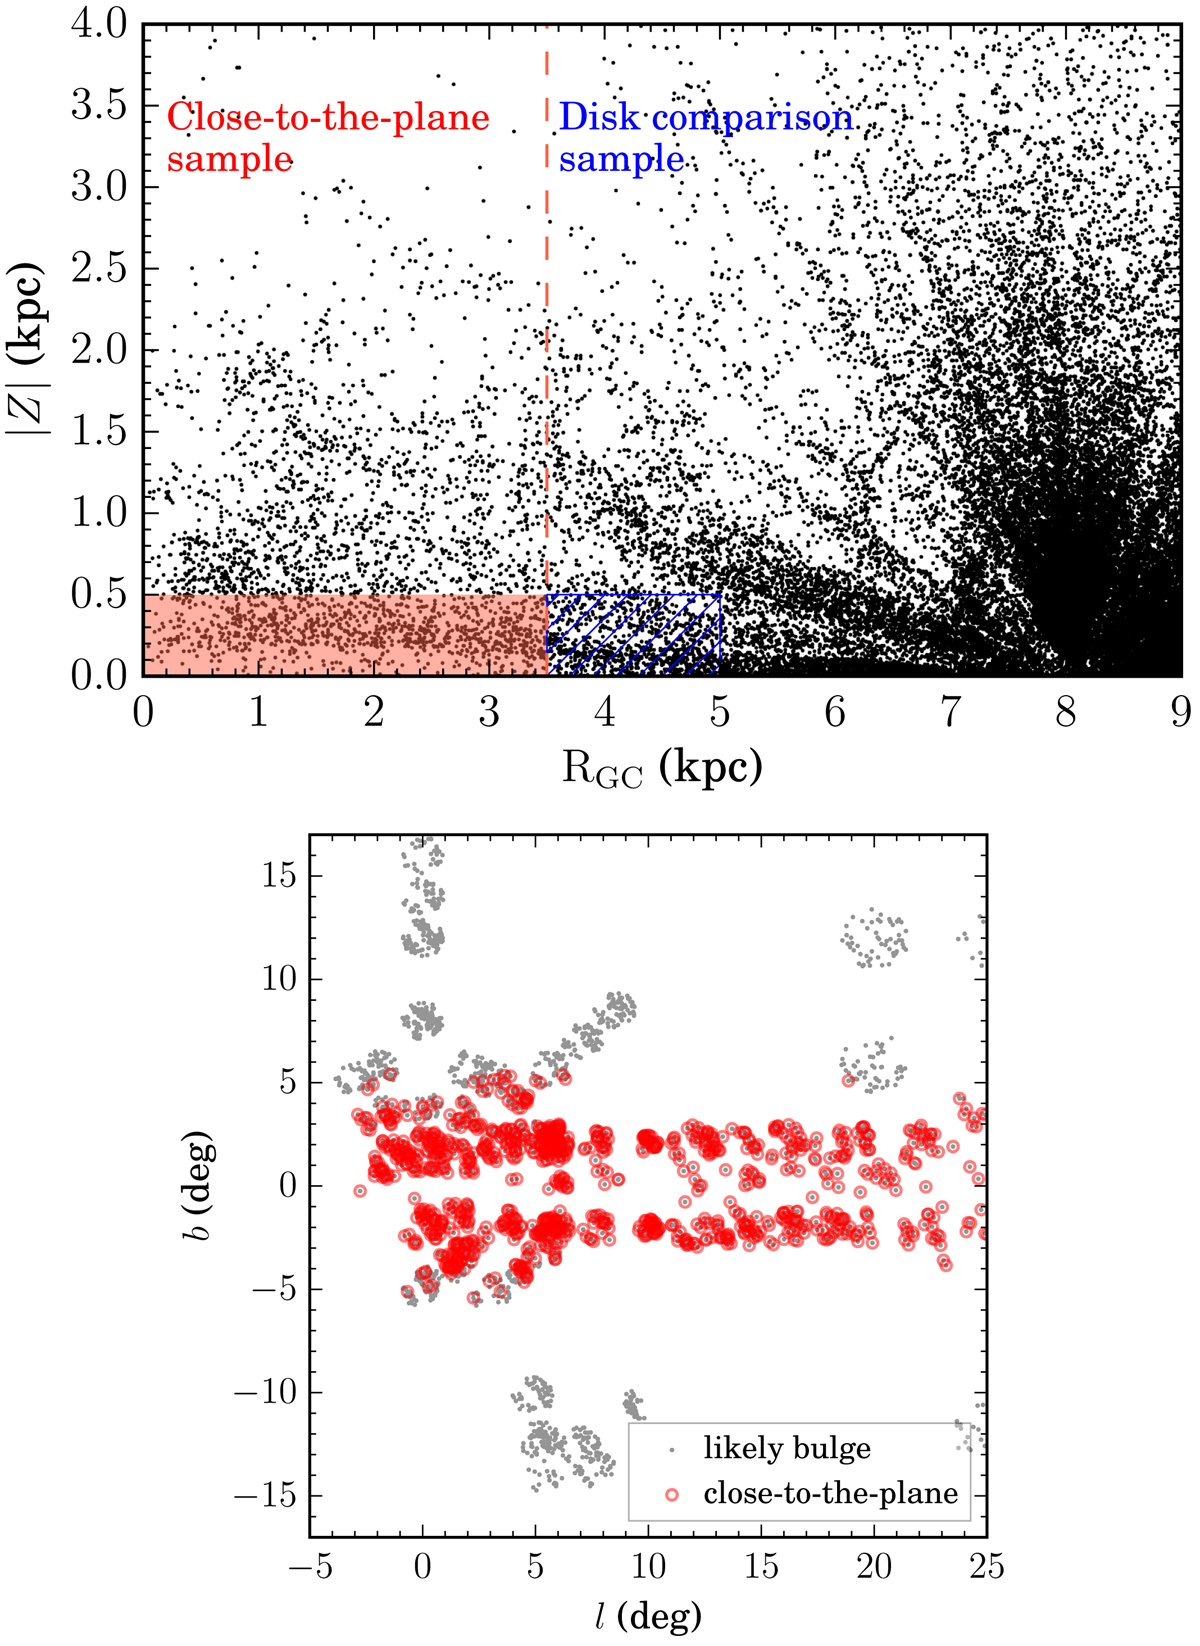
Spectro-photometric distances. Upper panel: distribution of stars in radial Galactocentric distance versus absolute distance from the plane. Black points depict the flag-culled sample selected from DR14 as described in the main text. The dashed vertical line and the shaded area depict the cuts used to select our likely bulge sample and the close-to-the-plane subselection, respectively. The hatched area highlights the region used to select a disk-comparison sample (Sect. 4.2). Lower panel: (l, b) distribution of the likely bulge (gray dots) and close-to-the-plane (red circles, with transparency to emphasize their concentration towards the center) samples.
Current usage metrics show cumulative count of Article Views (full-text article views including HTML views, PDF and ePub downloads, according to the available data) and Abstracts Views on Vision4Press platform.
Data correspond to usage on the plateform after 2015. The current usage metrics is available 48-96 hours after online publication and is updated daily on week days.
Initial download of the metrics may take a while.