Fig. 8
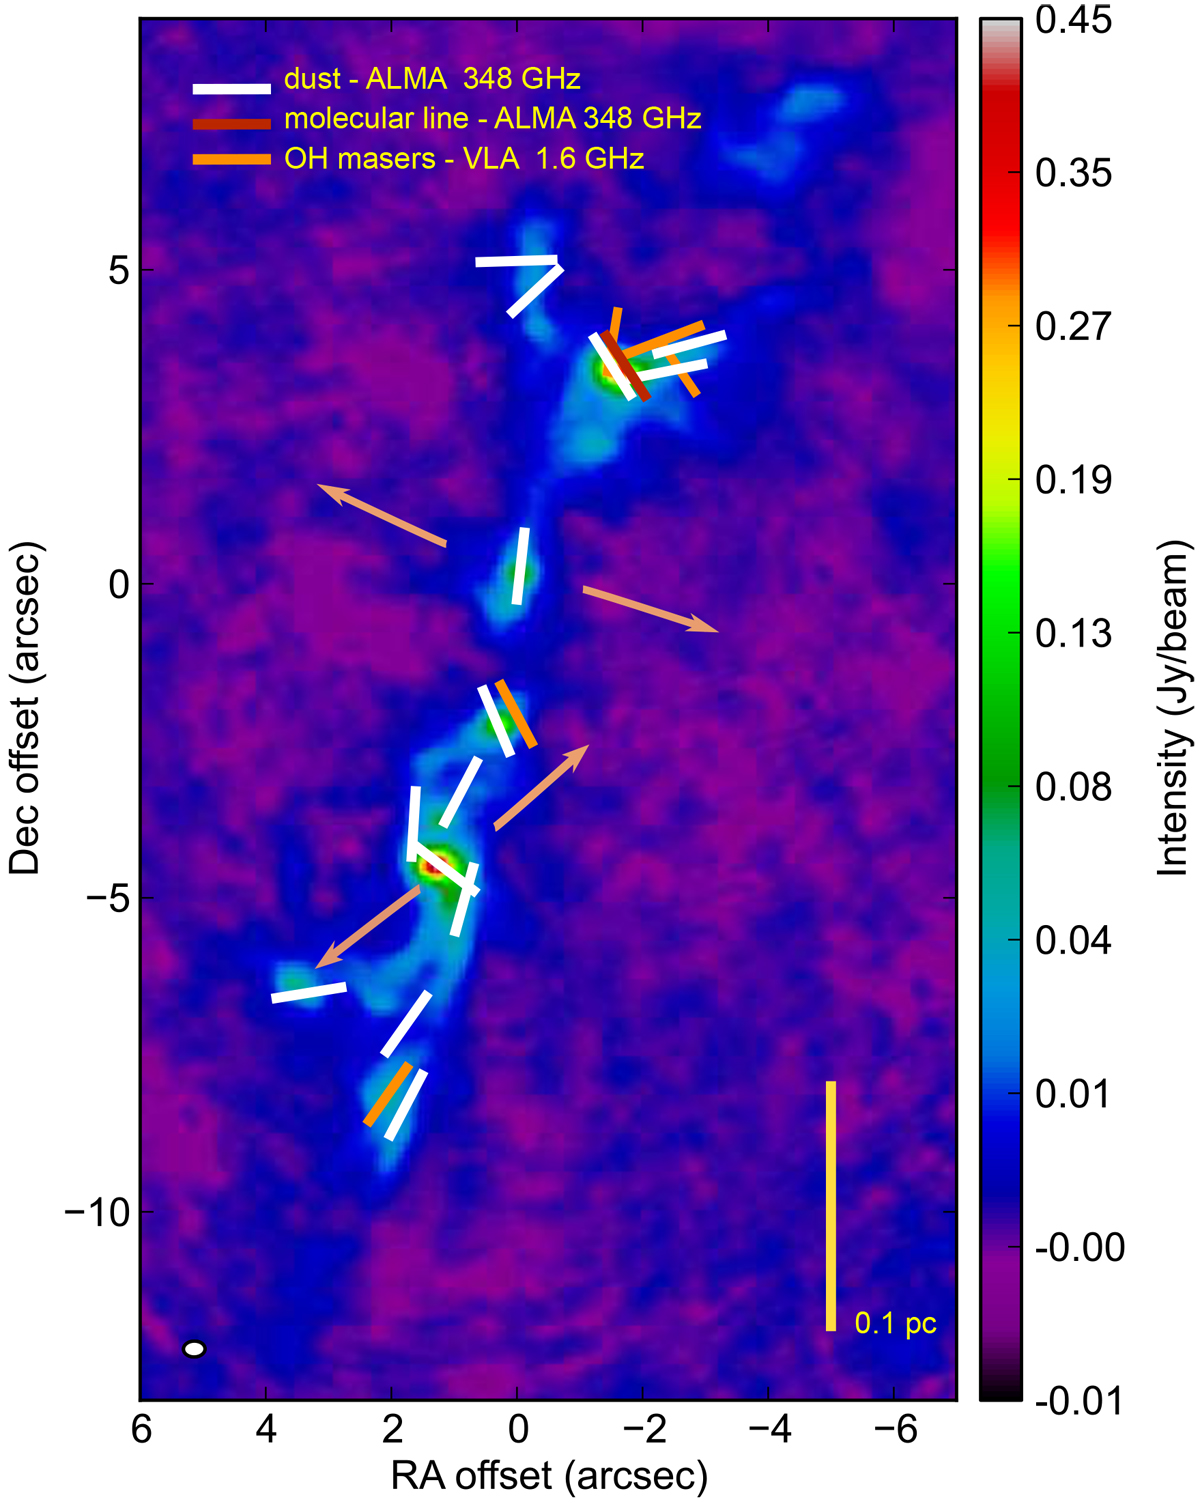
Totalintensity image of the star forming region G9.62+0.19 and linear polarisation segments, rotated by 90°, indicating the average direction of the magnetic field on scales of ~0.5′′× 0.5′′. The different colours in the segments delineate the direction of the magnetic field as detected by different data at different wavelengths. The white and brown bars indicate dust observations and molecular thermal line, respectively, from our ALMA band 7 polarised data. The orange bars indicate OH maser linearly polarised observations (Fish et al. 2005a; Fish & Reid 2006). Arrows denote the direction of the outflows (L17). The offsets are relative to the absolute position in Fig. 3. The white ellipse represents the beam. The colour scale goes from −0.01 to 0.45 Jy beam−1 and the yellow bar indicates the physical scale of 0.1 pc, at the distance of the source.
Current usage metrics show cumulative count of Article Views (full-text article views including HTML views, PDF and ePub downloads, according to the available data) and Abstracts Views on Vision4Press platform.
Data correspond to usage on the plateform after 2015. The current usage metrics is available 48-96 hours after online publication and is updated daily on week days.
Initial download of the metrics may take a while.