Fig. 7
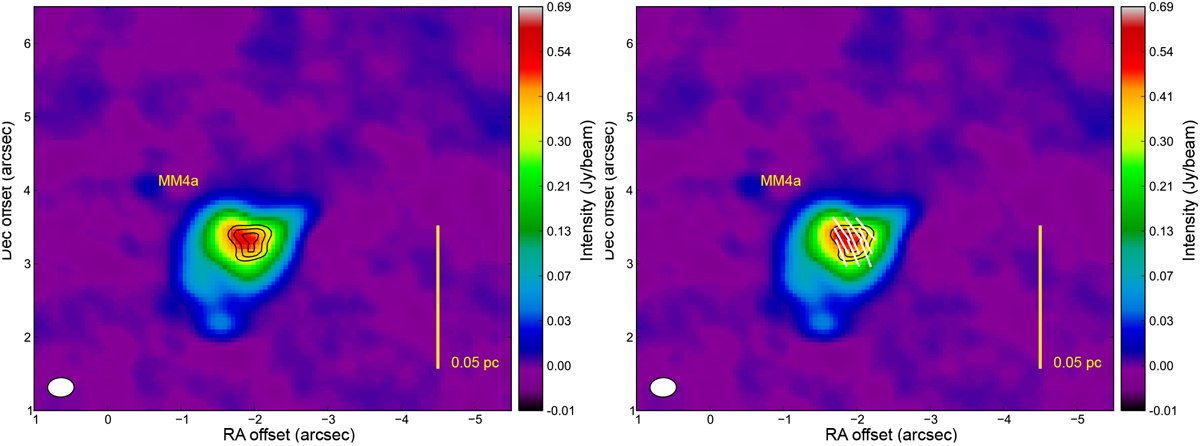
Total intensity image of the thermal line emitted in the core MM4a. Left panel: the contours represent linearly polarised emission and the levels are (1.4, 1.9, 2.3) mJy beam−1. The linear polarisation peak intensity is 2.38 mJy beam−1. Right panel: the segments indicate linear polarisation vectors already rotated by 90° to show the orientation of the magnetic field. The sampling of the vectors are every 165 by 165 mas. In both panels, the offsets are relative to the same position as in Fig. 3 and the colour scale indicates the total intensity in Jy beam−1, going from −0.01 to 0.52 Jy beam−1; the yellow bar indicates the physical scale of 0.05 pc at the distance of the source.
Current usage metrics show cumulative count of Article Views (full-text article views including HTML views, PDF and ePub downloads, according to the available data) and Abstracts Views on Vision4Press platform.
Data correspond to usage on the plateform after 2015. The current usage metrics is available 48-96 hours after online publication and is updated daily on week days.
Initial download of the metrics may take a while.