Fig. 6
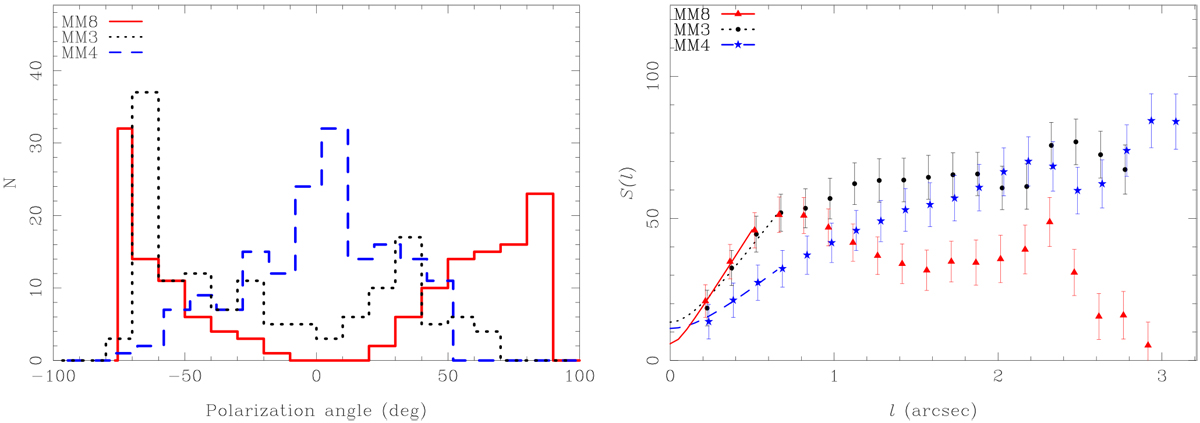
Left panel: histograms of polarisation orientation angle ψ, towards the sources MM3, MM4, and MM8. Nyquist sampling was applied and each bin is 10° wide. Right panel: square root of the SF of the polarisation orientation angles, S(l) for the cores MM3, MM4, and MM8 represented by the black dots, blue stars, and red triangles, respectively. The best fits for MM3, MM4, and MM8 are plotted as the dotted black line, dashed blue line, and solid red line, respectively. In the SF plot, we applied Nyquist sampling and a bin of 0.15′′.
Current usage metrics show cumulative count of Article Views (full-text article views including HTML views, PDF and ePub downloads, according to the available data) and Abstracts Views on Vision4Press platform.
Data correspond to usage on the plateform after 2015. The current usage metrics is available 48-96 hours after online publication and is updated daily on week days.
Initial download of the metrics may take a while.