Free Access
Fig. 9.
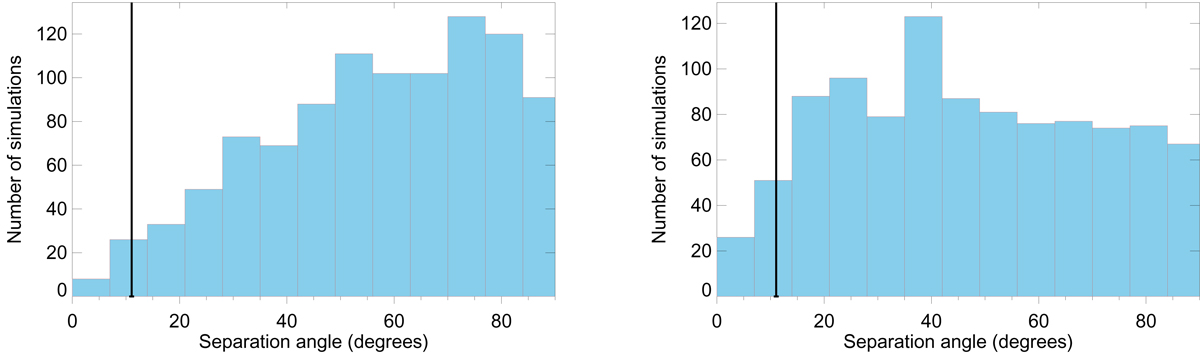
Angular separation between the quadrupole and octopole preferred directions. Left panel: distribution of this angular distance for 1000 Gaussian simulations, right panel: corresponding distribution for 1000 non-Gaussian simulations. The vertical black line represents the angular distance observed in the Planck data.
Current usage metrics show cumulative count of Article Views (full-text article views including HTML views, PDF and ePub downloads, according to the available data) and Abstracts Views on Vision4Press platform.
Data correspond to usage on the plateform after 2015. The current usage metrics is available 48-96 hours after online publication and is updated daily on week days.
Initial download of the metrics may take a while.