Fig. 8.
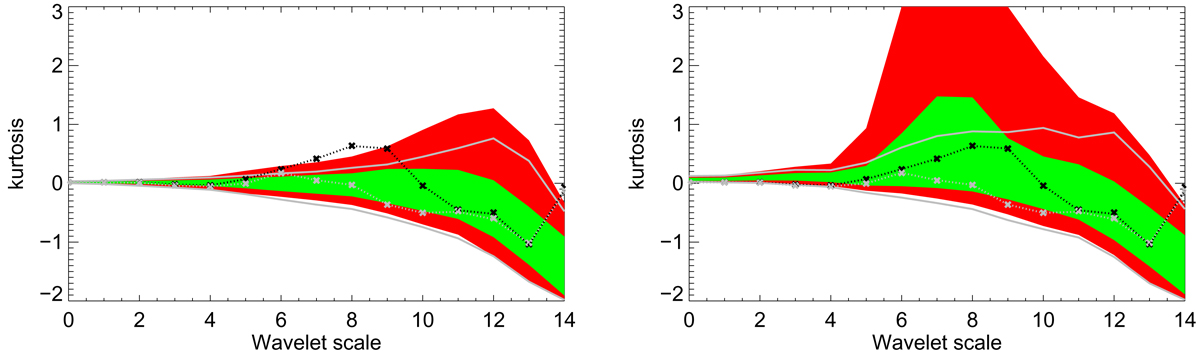
Kurtosis of wavelet coefficients for the wavelet scales defined in Vielva et al. (2004). Green and red bands show the 1σ and 2σ spread of kurtosis values in 1000 Gaussian simulations (left panel) and 1000 non-Gaussian model simulations (right panel). The black crosses indicate the kurtosis values computed from the Planck data; the grey crosses show the values derived after masking the brightest spot for the given wavelet scale. The grey lines show the 2σ limits after masking the brightest spot for the given scale. The masking is performed with a disc of radius 5 degrees.
Current usage metrics show cumulative count of Article Views (full-text article views including HTML views, PDF and ePub downloads, according to the available data) and Abstracts Views on Vision4Press platform.
Data correspond to usage on the plateform after 2015. The current usage metrics is available 48-96 hours after online publication and is updated daily on week days.
Initial download of the metrics may take a while.